本文采用CC-BY-SA-4.0协议发布,但本文代码采用LGPL v2.1+协议公开
前言
- 在之前的GTK/Vala开发基础教程发布后🕊了2年终于写了一篇后续。🥲🥲🥲
本文假设读者已经阅读了笔者的上一篇GTK/Vala开发基础教程,已经对GTK/Vala的基本概念有所了解。本文将通过简单的例子,展示如何使用GTK4和Vala构建一个简单的应用程序。本文的例子均与太阳☀️☀️☀️有关。
GTK4应用:白昼时长计算与绘制工具
笔者在这里用一个有趣的例子来展示如何构建一个简单的应用程序。该程序用到了GTK4的许多组件(有意识地在用GTK4下新增的,推荐的,或者行为发生改变的组件),以及Cairo的绘图功能。
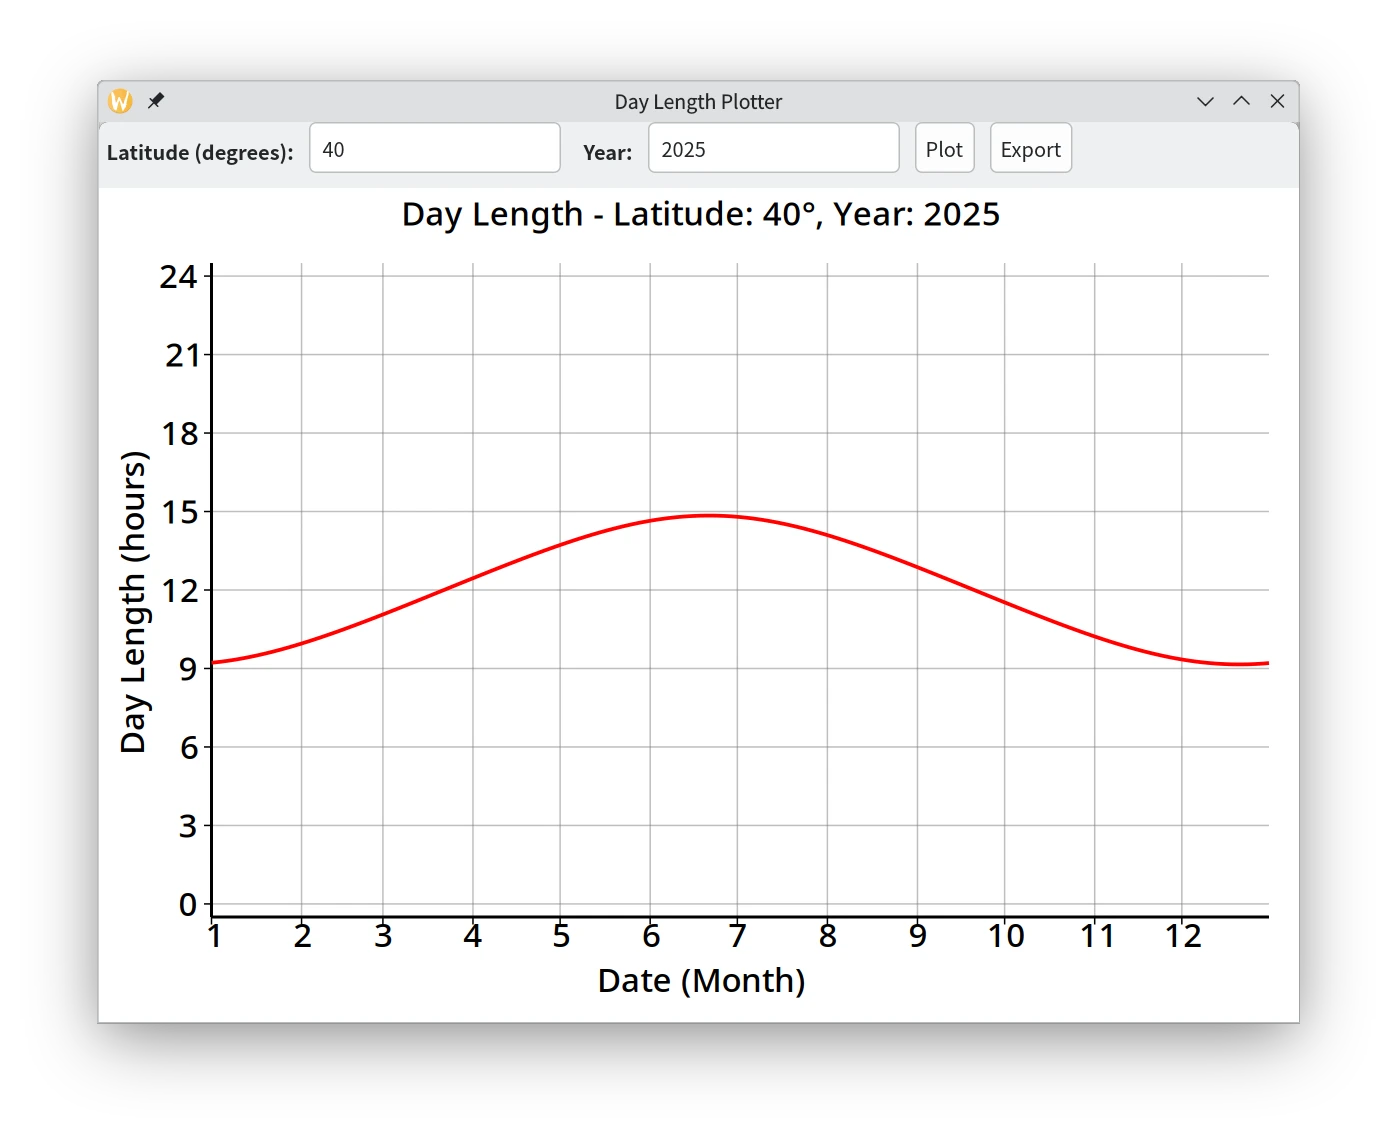
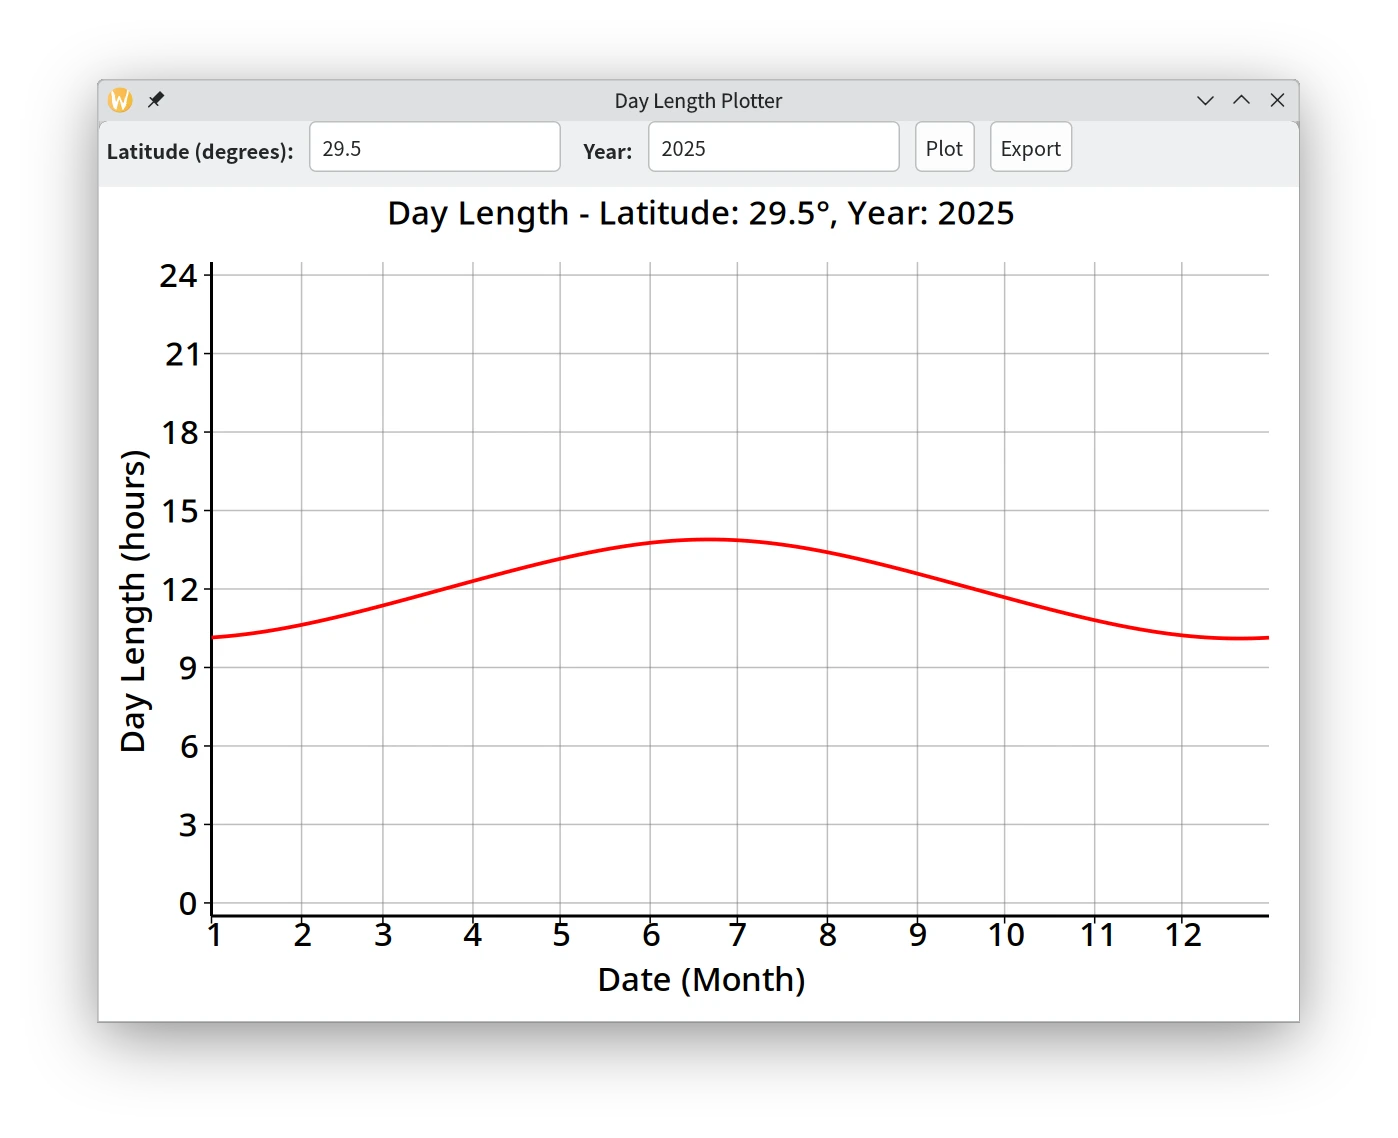
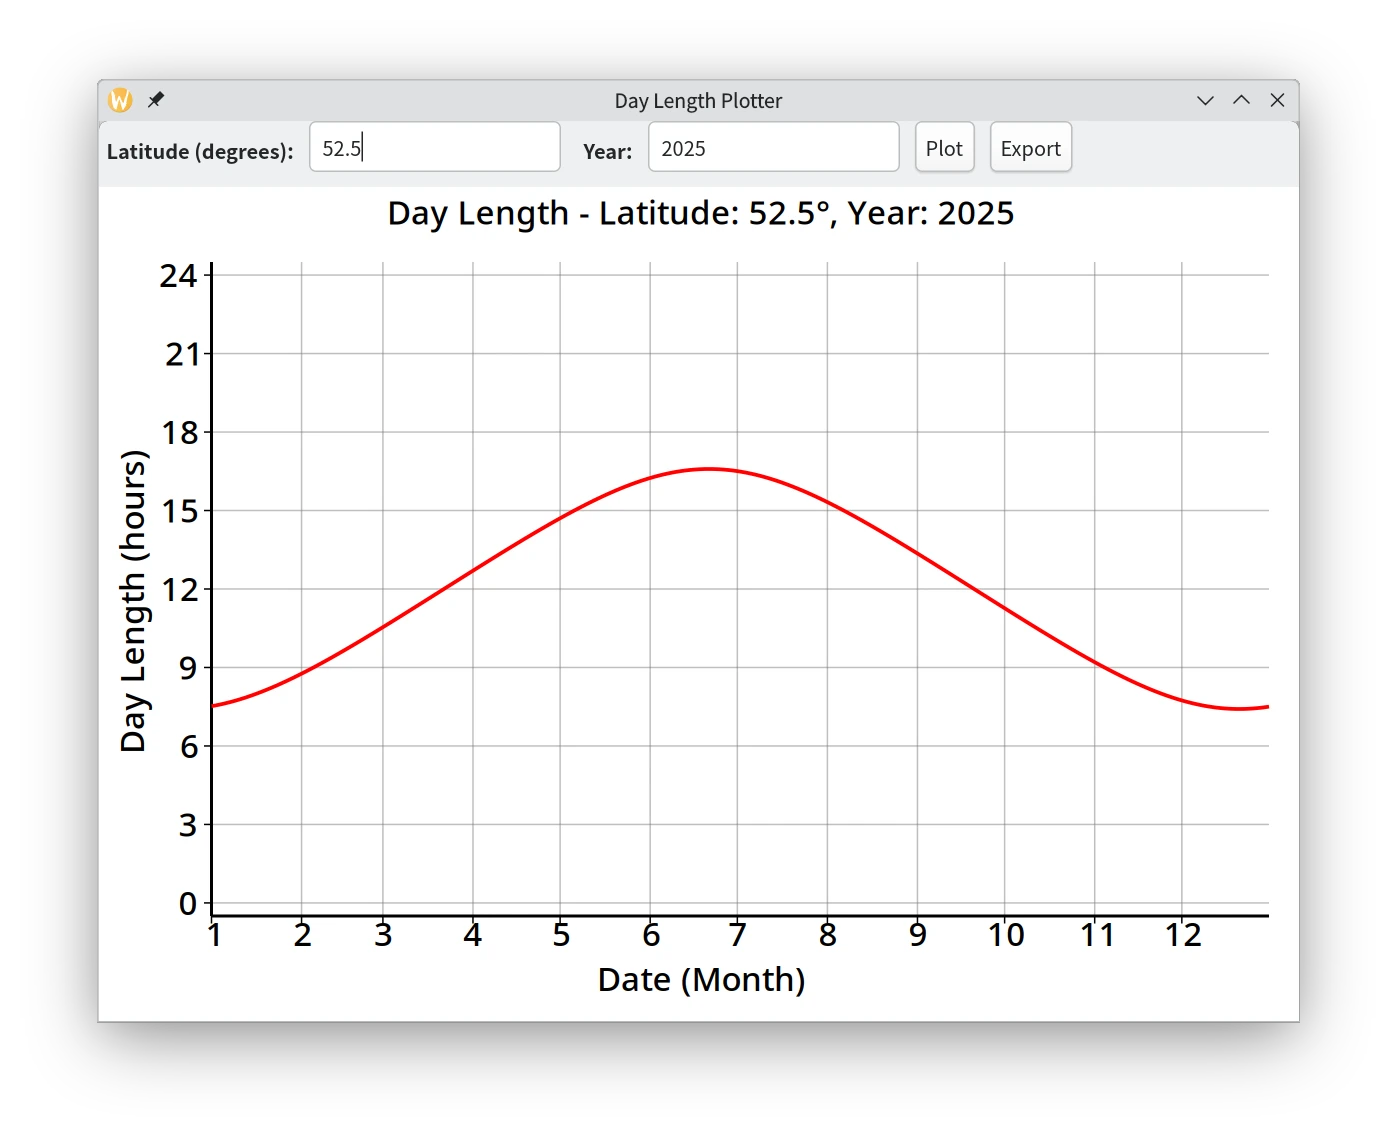
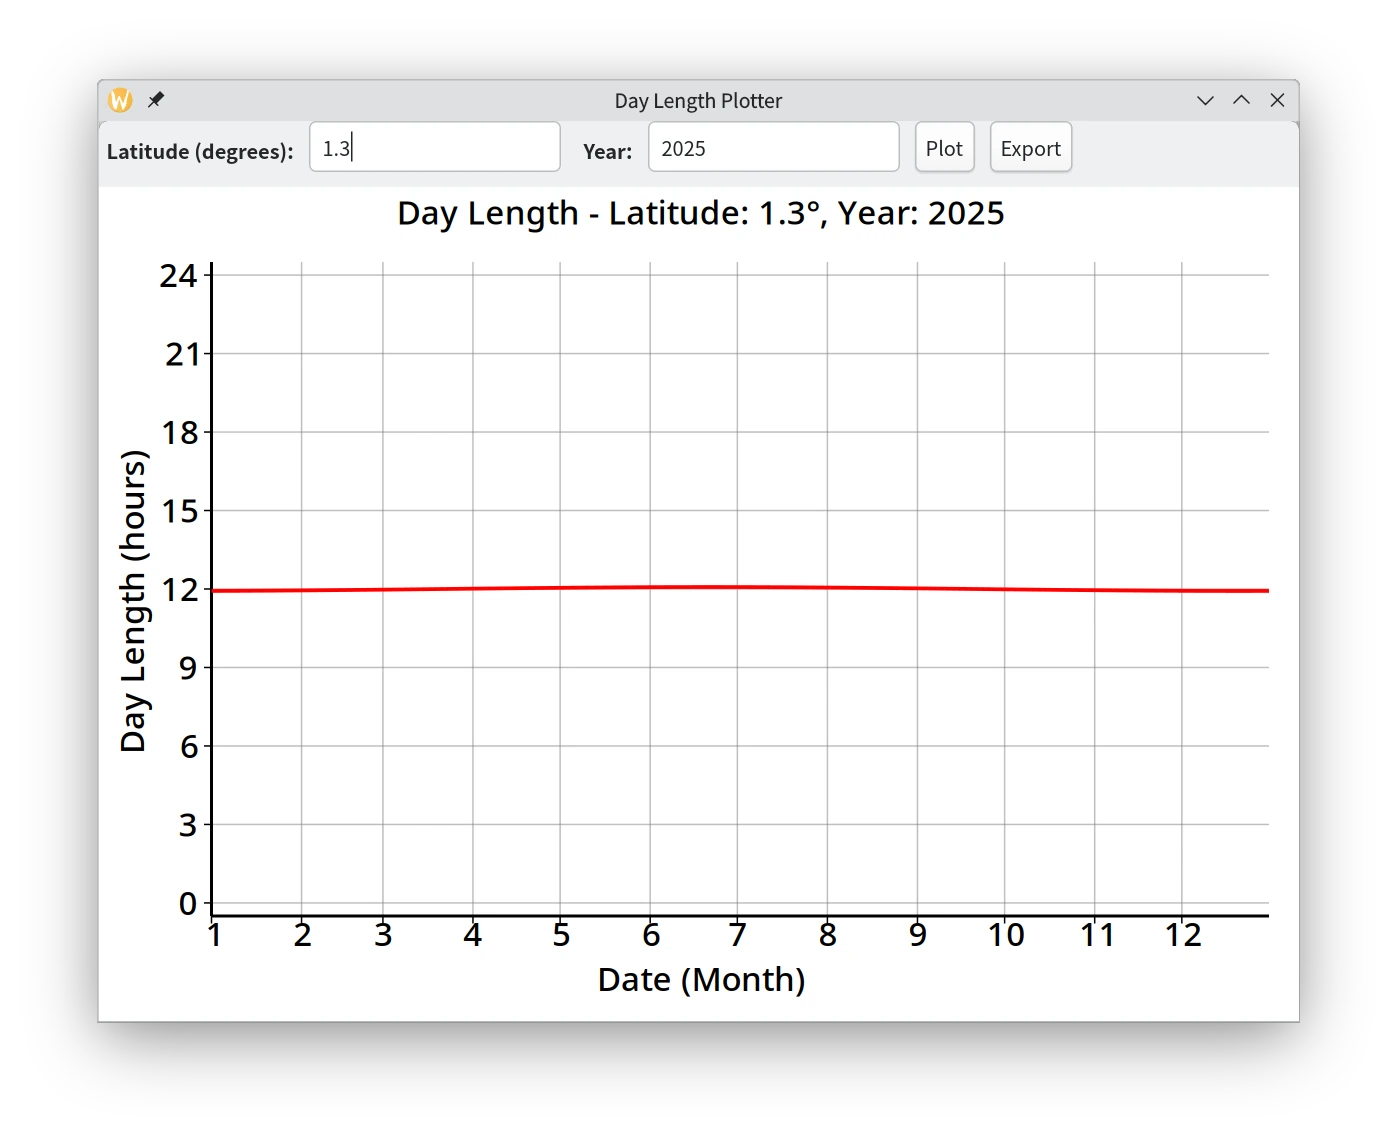
这个应用程序可用于计算在不同纬度下,全年的每一天的白昼时长。为了方便,程序做了这些简化:
- 不考虑大气折射
- 不考虑进动(岁差)
- 假设地球公转与自转的角速度恒定且完全与格里高利历对齐
- 假设自转倾角恒定为23.44°
运行效果
 |
 |
| 北京 | 重庆 |
 |
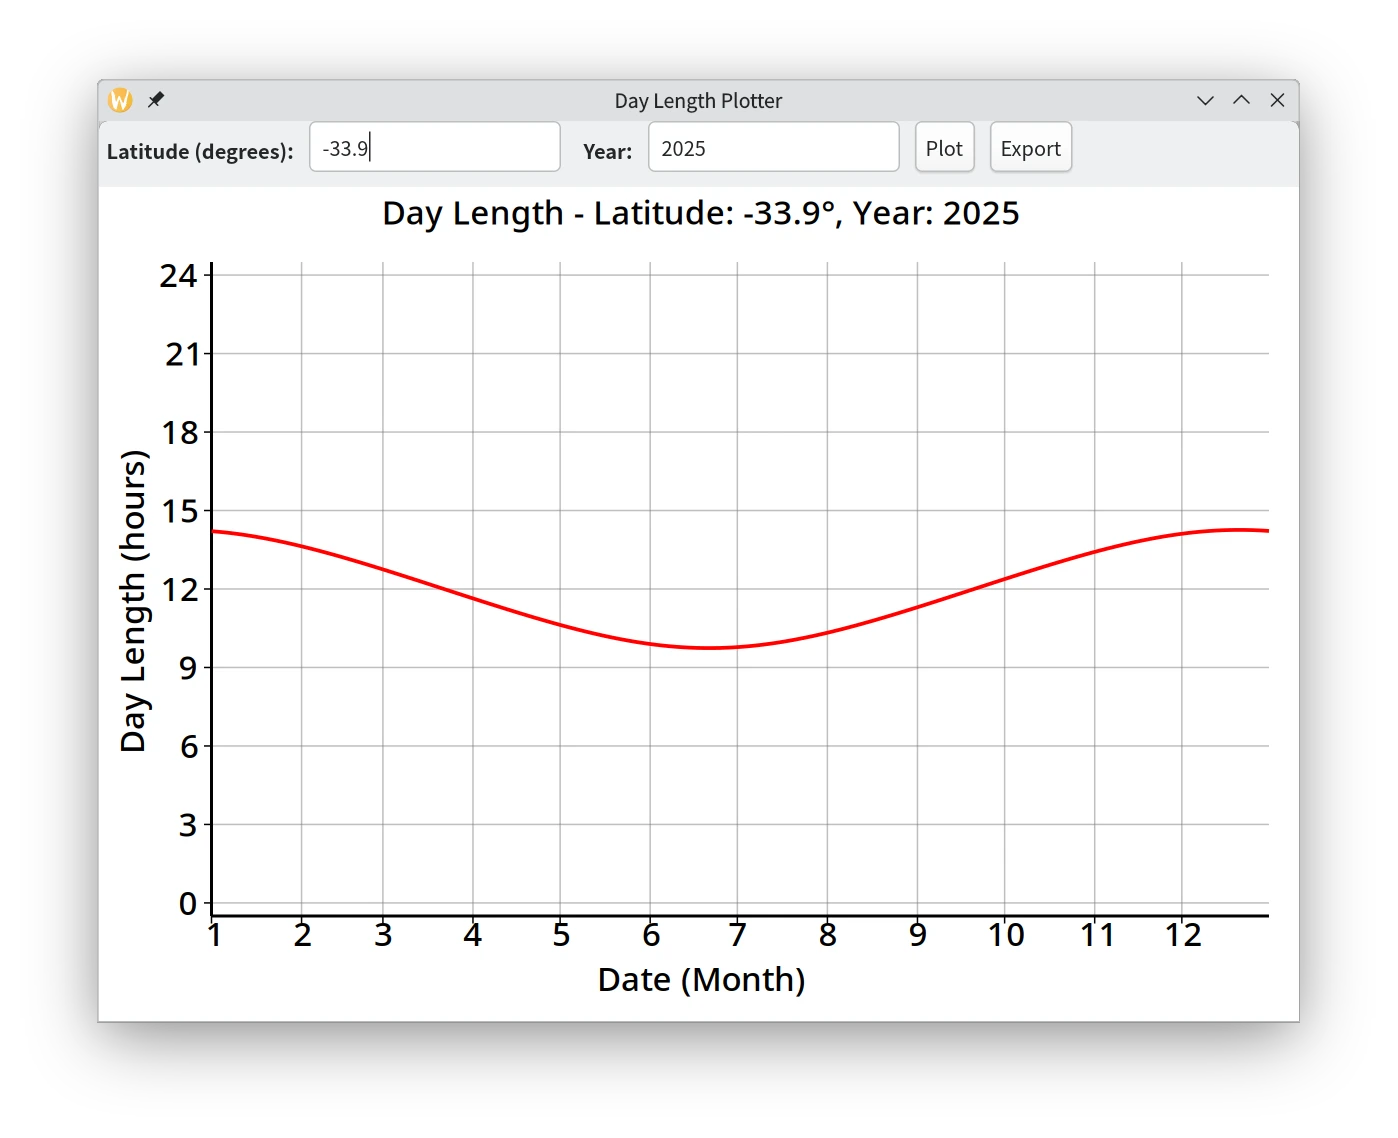 |
| 柏林 | 悉尼 |
 |
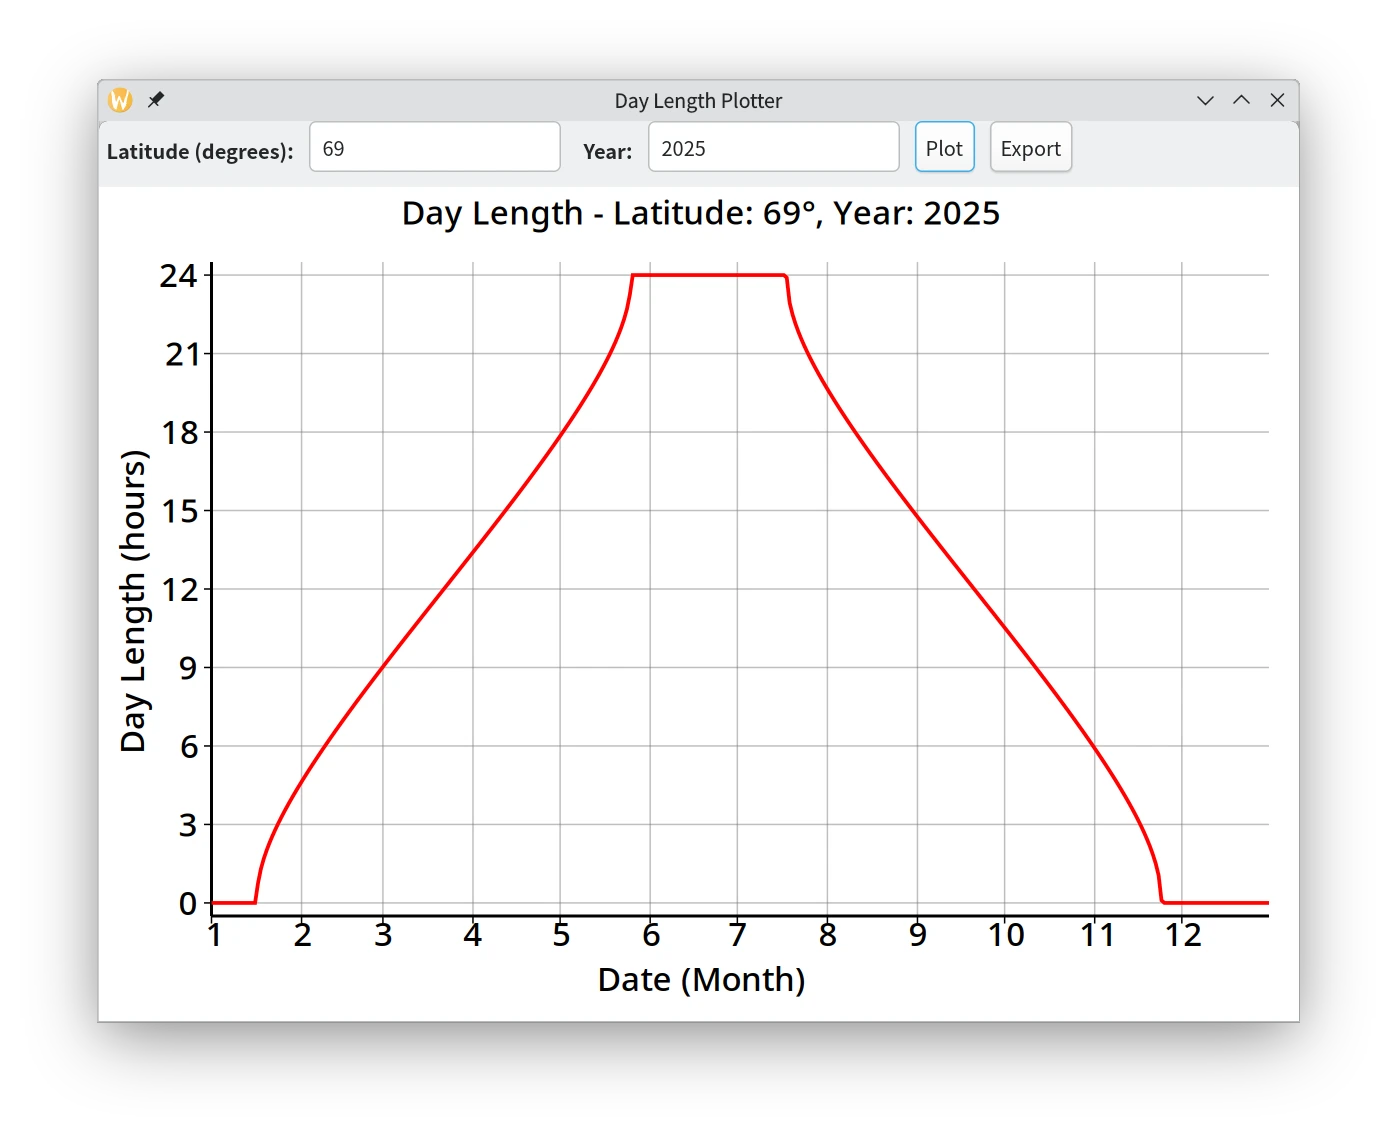 |
| 新加坡 | 摩尔曼斯克 |
 |
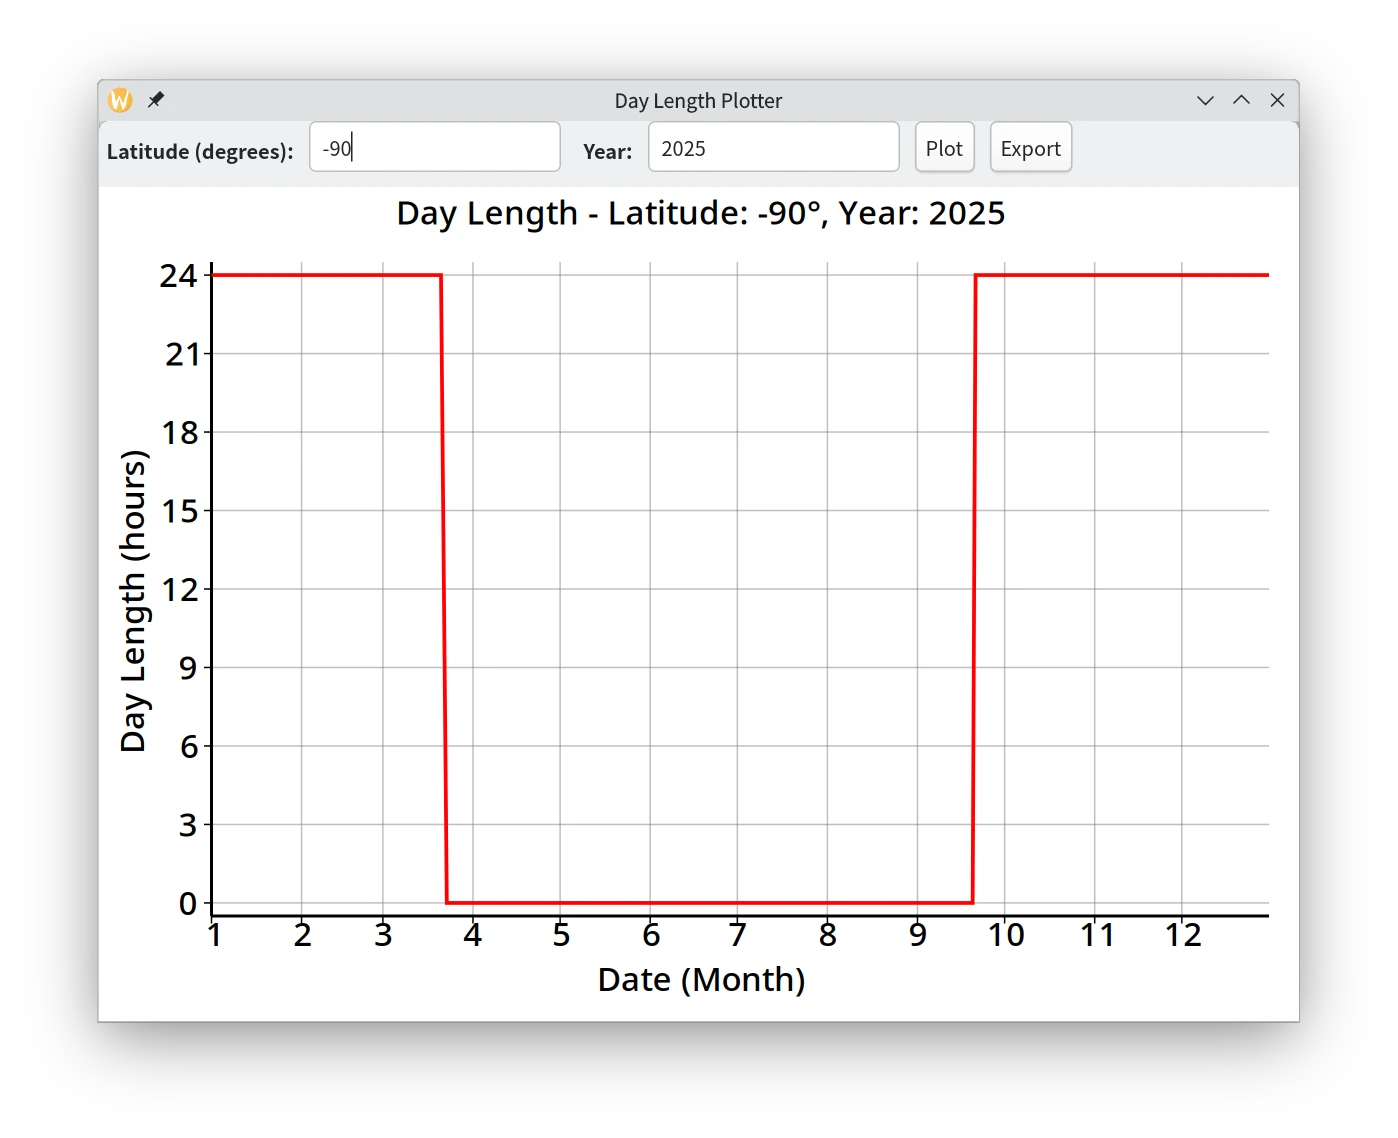 |
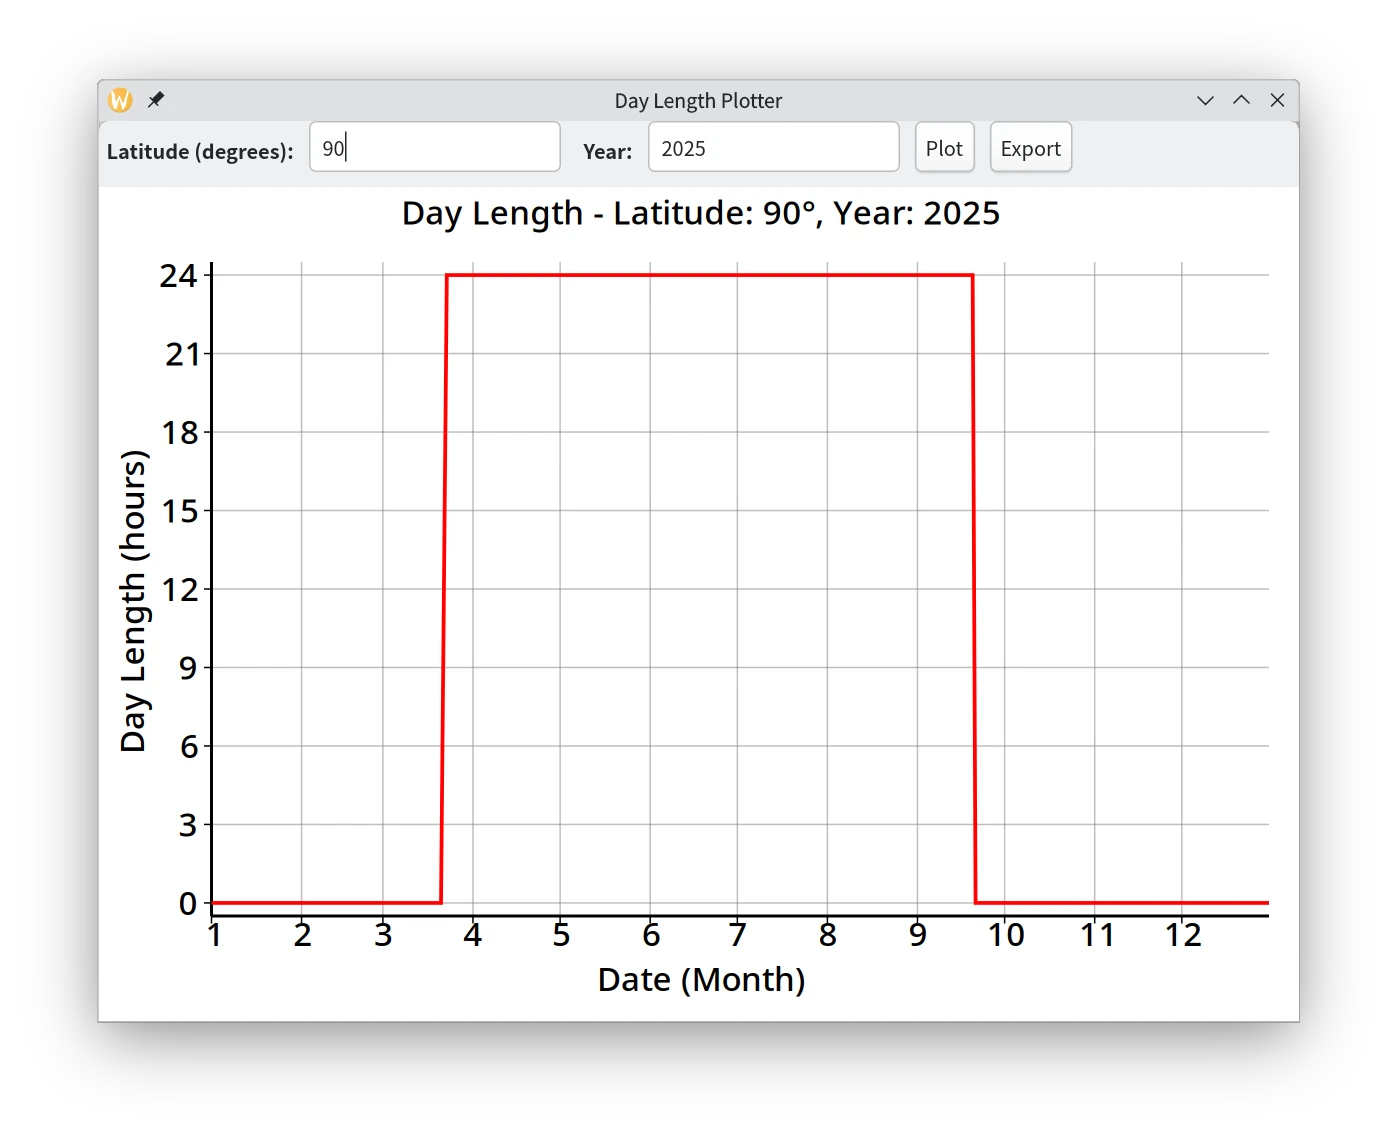
| 北极点 | 南极点 |
程序架构
辅助函数
-
days_in_year (int year)
判断给定年份是否为闰年,返回一年中的天数。
判断规则:能被 400 整除,或者能被 4 整除但不能被 100 整除的为闰年。 -
solar_declination (int n)
利用近似公式计算第 n 天的太阳赤纬角(弧度),公式为:
$\delta = 23.44 \times \frac{\pi}{180} \times \sin\left(\frac{2\pi}{365} \times (n - 81)\right)$。 其中81为春分日的天数偏移量(1月1日为第1天)。一般春分日的偏移量其实是79,但是由于地球的轨道是椭圆形的,春分-秋分时长与秋分-春分时长并不完全相等,完全对齐春分日的偏移量会导致秋季误差较大,因此这里使用了能够相对平衡春秋两季的偏移量81。 compute_day_length (double latitude_rad, int n)
根据输入的纬度(弧度)和天数,计算当天的日照时长(单位:小时)。
使用公式 $X = -\tan(\phi)\tan(\delta)$ 计算 X 值,其中 $\phi$ 为纬度(弧度)、$\delta$ 为太阳赤纬角(弧度)。
此处 X 表示太阳在地平面上升降时刻对应的余弦值,即 $\cos(\omega_0)$,通过 X 的取值判断:- 若 $X$ 在 $[-1, 1]$ 内,则通过 $\omega_0 = \arccos(X)$ 计算出太阳的小时角,再利用该角度计算日照时长;
- 若 $X < -1$,则表示处于极昼状态(日照 24 小时);
- 若 $X > 1$,则表示处于极夜状态(日照 0 小时)。
generate_day_lengths (double latitude_rad, int year)
遍历一年中的每一天,调用compute_day_length计算各天日照时长,返回包含所有白昼时长数据的数组。
主窗口类 DayLengthWindow
此类继承自 Gtk.ApplicationWindow,是应用程序的顶层窗口,负责构建图形界面和显示绘图内容。Gtk.ApplicationWindow 是与 Gtk.Application 集成良好的窗口类型,能更好地管理应用的生命周期。
- 界面组件
- 布局容器
Gtk.Box:GTK中最常用的布局容器之一。笔者使用了一个垂直方向的Gtk.Box(vbox_main) 作为主容器,并在其内部放置了一个水平方向的Gtk.Box(hbox_controls) 用于排列输入控件。Gtk.Box通过orientation属性(Gtk.Orientation.VERTICAL或Gtk.Orientation.HORIZONTAL)和spacing属性来控制子控件的排列方式和间距,非常适合线性的布局需求。 - 文本输入
Gtk.Entry:latitude_entry和year_entry使用Gtk.Entry控件,允许用户输入单行文本。通过设置input_purpose属性(如Gtk.InputPurpose.NUMBER或Gtk.InputPurpose.DIGITS),可以向输入法提示期望的输入类型,改善触摸键盘上的用户体验。width_chars属性则可以粗略地根据字符数量设定输入框的初始宽度。 - 按钮
Gtk.Button:“Plot”和“Export”按钮均使用Gtk.Button.with_label()构造,这是创建带文本标签按钮的便捷方法。按钮的核心功能通过连接其clicked信号来实现。 - 标签
Gtk.Label:用于显示描述性文本。通过设置use_markup = true,可以使用 Pango 标记语言进行简单的文本格式化,例如本例中的<b>Latitude (degrees):</b>使文本加粗。halign = Gtk.Align.START确保标签文本左对齐。 - 绘图区域
Gtk.DrawingArea:drawing_area是一个空白的画布控件,专门用于自定义绘图。通过set_draw_func()方法注册一个绘图回调函数 (draw_plot),当控件需要重绘时(例如窗口大小改变或调用queue_draw()),该函数会被调用,并传入一个Cairo.Context对象用于绘图。设置hexpand = true和vexpand = true使绘图区域能够填充父容器的额外空间。
- 布局容器
- 事件处理
- “Plot” 按钮的
clicked信号连接到一个匿名函数,该函数调用update_plot_data()读取输入、更新数据,然后通过drawing_area.queue_draw()请求重绘图表。queue_draw()会标记Gtk.DrawingArea为“脏”,并在下一个合适的时机触发其绘图函数。 - “Export” 按钮的
clicked信号也连接到一个匿名函数,该函数负责弹出文件保存对话框。- 文件对话框
Gtk.FileDialog:这是 GTK4 中用于文件选择的现代化API。笔者创建一个Gtk.FileDialog对象,设置其为modal = true使其成为模态对话框。通过initial_name设置默认文件名。 - 文件过滤器
Gtk.FileFilter:为了限制用户可选的文件类型,笔者创建了Gtk.FileFilter实例,并通过add_mime_type()指定支持的MIME类型(如 “image/png”, “image/svg+xml”, “application/pdf”)。这些过滤器被添加到一个ListStore中,并赋给Gtk.FileDialog的filters属性。 - 异步操作:文件保存操作通过
file_dialog.save.begin()和file_dialog.save.end()以异步方式执行,避免阻塞主线程。回调函数在操作完成(或取消)时被调用,通过file_dialog.save.end(res)获取选择的File对象。 - 导出时,根据文件扩展名选择创建
Cairo.ImageSurface(PNG)、Cairo.SvgSurface(SVG) 或Cairo.PdfSurface(PDF) 作为绘图表面,然后调用draw_plot()在这个表面上绘制图表,最后完成文件写入。
- 文件对话框
- “Plot” 按钮的
- 绘图操作
drawing_area使用Gtk.DrawingArea,并注册了绘图回调draw_plot ()。draw_plot ()中利用Cairo库完成以下工作:- 清空背景并设置为白色。
- 定义绘图区域的边距、X/Y 轴范围。
- 绘制横向和纵向的网格线、刻度及文字标签(包括月份和小时刻度)。
- 绘制坐标轴,其中 X/Y 轴均加粗显示。
- 利用计算得到的
day_lengths数据绘制红色的日照时长曲线。 - 额外绘制坐标轴标题,其中 Y 轴文字通过旋转操作实现垂直显示。
应用管理类 DayLengthApp 及 main 函数
DayLengthApp类 继承自Gtk.Application,这是管理 GTK 应用程序生命周期的核心类。它负责处理应用的初始化、激活、命令行参数以及确保应用只有一个实例在运行(通过application_id)。activate()回调函数 当应用被激活时(通常是首次启动或用户尝试启动已运行的应用实例时),activate方法会被调用。在这里,笔者创建主窗口DayLengthWindow的实例,并通过win.present()将其显示给用户。main()函数 程序的入口,创建DayLengthApp对象并启动事件循环,处理命令行参数。
实现代码
实现这个应用程序的代码如下:
#!/usr/bin/env -S vala --pkg=gtk4 -X -lm -X -O2 -X -march=native

// Helper functions to compute day-of-year, solar declination and day length

/**
 * Returns the number of days in a given year.
 *
 * @param year The year to calculate the number of days.
 * @return Total number of days in the year.
 */
private inline int days_in_year (int year) {
    // Leap year: divisible by 400 or divisible by 4 but not by 100.
    if ((year % 4 == 0) && ((year % 100 != 0) || (year % 400 == 0))) {
        return 366;
    }
    return 365;
}

/**
 * Computes solar declination in radians using an approximate formula.
 *
 * Formula: δ (rad) = (23.44 * π/180) * sin(2π/365 * (n - 81))
 *
 * @param n The day number in the year.
 * @return Solar declination in radians.
 */
private inline double solar_declination (int n) {
    return (23.44 * Math.PI / 180.0) * Math.sin (2 * Math.PI / 365.0 * (n - 81));
}

/**
 * Calculates the day length (in hours) for a given latitude (in radians) and day number.
 *
 * Using formula: T = (24/π) * arccos( -tan(φ) * tan(δ) )
 *
 * φ: observer's latitude, δ: solar declination
 *
 * When |tan φ * tan δ| > 1, returns polar day (24 hours) or polar night (0 hours)
 *
 * @param latitude_rad Latitude in radians.
 * @param n The day number in the year.
 * @return Day length in hours.
 */
private inline double compute_day_length (double latitude_rad, int n) {
    double phi = latitude_rad;
    double delta = solar_declination (n);
    double X = -Math.tan (phi) * Math.tan (delta);
    if (X < -1) {
        return 24.0; // Polar day
    } else if (X > 1) {
        return 0.0;  // Polar night
    } else {
        // 'omega0' is the half-angle (in radians) corresponding to the time from sunrise to solar noon.
        // Since 2π radians represent 24 hours, 1 radian equals 24/(2π) hours.
        // Multiplying omega0 by (24/Math.PI) converts this angle to the total day length in hours.
        double omega0 = Math.acos (X); // computed in radians
        double T = (24.0 / Math.PI) * omega0; // convert to hours
        return T;
    }
}

/**
 * Generates an array of day lengths for all days at the given latitude (in radians) and year.
 *
 * @param latitude_rad Latitude in radians.
 * @param year The year for which to generate day lengths.
 * @return Array of day lengths in hours.
 */
private inline double[] generate_day_lengths (double latitude_rad, int year) {
    int total_days = days_in_year (year);
    double[] lengths = new double[total_days];
    for (int i = 0; i < total_days; i += 1) {
        lengths[i] = compute_day_length (latitude_rad, i + 1);
    }
    return lengths;
}

/**
 * Window for displaying the day length plot.
 */
public class DayLengthWindow : Gtk.ApplicationWindow {
    private Gtk.Entry latitude_entry;
    private Gtk.Entry year_entry;
    private Gtk.DrawingArea drawing_area;
    private double[] day_lengths;
    private int current_year;
    private double latitude_deg;
    private Gtk.Button export_button;

    /**
     * Constructs a new DayLengthWindow.
     *
     * @param app The Gtk.Application instance.
     */
    public DayLengthWindow (Gtk.Application app) {
        Object (
            application: app,
            title: "Day Length Plotter",
            default_width: 800,
            default_height: 600
        );

        // Initialize current_year first
        DateTime now = new DateTime.now_local ();
        current_year = now.get_year ();

        // Use vertical box as the main container
        var vbox_main = new Gtk.Box (Gtk.Orientation.VERTICAL, 10) {
            // Add top margin but do not add other margins since drawing area expands
            margin_top = 10
        };
        this.child = vbox_main;

        // Input area (using horizontal Box layout)
        var hbox_controls = new Gtk.Box (Gtk.Orientation.HORIZONTAL, 10) {
            margin_start = 10,
            margin_end = 10
        };
        vbox_main.append (hbox_controls);

        var lat_label = new Gtk.Label ("<b>Latitude (degrees):</b>") {
            halign = Gtk.Align.START,
            use_markup = true
        };
        hbox_controls.append (lat_label);

        latitude_entry = new Gtk.Entry () {
            width_chars = 10,
            input_purpose = Gtk.InputPurpose.NUMBER
        };
        hbox_controls.append (latitude_entry);

        var year_label = new Gtk.Label ("<b>Year:</b>") {
            halign = Gtk.Align.START,
            use_markup = true
        };
        hbox_controls.append (year_label);

        year_entry = new Gtk.Entry () {
            width_chars = 10,
            input_purpose = Gtk.InputPurpose.DIGITS,
            // Set year entry text using current_year
            text = current_year.to_string ()
        };
        hbox_controls.append (year_entry);

        var plot_button = new Gtk.Button.with_label ("Plot");
        hbox_controls.append (plot_button);
        plot_button.clicked.connect (() => {
            update_plot_data ();
            drawing_area.queue_draw ();
        });

        // Export image button
        export_button = new Gtk.Button.with_label ("Export");
        hbox_controls.append (export_button);
        export_button.clicked.connect (() => {
            var png_filter = new Gtk.FileFilter ();
            png_filter.name = "PNG Images";
            png_filter.add_mime_type ("image/png");

            var svg_filter = new Gtk.FileFilter ();
            svg_filter.name = "SVG Images";
            svg_filter.add_mime_type ("image/svg+xml");

            var pdf_filter = new Gtk.FileFilter ();
            pdf_filter.name = "PDF Documents";
            pdf_filter.add_mime_type ("application/pdf");

            // FileDialog.filters are required to contain default filter and others
            var filter_list = new ListStore (typeof (Gtk.FileFilter));
            filter_list.append (png_filter);
            filter_list.append (svg_filter);
            filter_list.append (pdf_filter);

            var file_dialog = new Gtk.FileDialog () {
                modal = true,
                initial_name = "daylength_plot.png",
                filters = filter_list
            };

            file_dialog.save.begin (this, null, (obj, res) => {
                try {
                    var file = file_dialog.save.end (res);
                    if (file != null) {
                        string filepath = file.get_path ();
                        export_plot (filepath);
                    }
                } catch (Error e) {
                    // Usually due to the user canceling the dialog
                    message ("File has not been saved: %s", e.message);
                }
            });
        });

        // Drawing area: using Gtk.DrawingArea and Cairo for plotting
        drawing_area = new Gtk.DrawingArea () {
            hexpand = true,
            vexpand = true
        };
        drawing_area.set_size_request (400, 400);
        drawing_area.set_draw_func (this.draw_plot);
        vbox_main.append (drawing_area);
    }

    /**
     * Updates plot data based on input values.
     */
    private void update_plot_data () {
        latitude_deg = double.parse (latitude_entry.text);
        current_year = int.parse (year_entry.text);
        // Convert input latitude (in degrees) to radians
        double latitude_rad = latitude_deg * Math.PI / 180.0;
        day_lengths = generate_day_lengths (latitude_rad, current_year);
    }

    /**
     * Drawing callback to render the day length plot.
     *
     * @param area The drawing area widget.
     * @param cr The Cairo context.
     * @param width The width of the drawing area.
     * @param height The height of the drawing area.
     */
    private void draw_plot (Gtk.DrawingArea area, Cairo.Context cr, int width, int height) {
        // Clear background to white
        cr.set_source_rgb (1, 1, 1);
        cr.paint ();

        // Set margins
        int margin_left = 75;
        int margin_right = 20;
        int margin_top = 50;
        int margin_bottom = 70;
        int plot_width = width - margin_left - margin_right;
        int plot_height = height - margin_top - margin_bottom;

        // Fixed Y axis range: -0.5 to 24.5
        double y_min = -0.5, y_max = 24.5;
        // X axis range: 1 to total_days
        int total_days = (day_lengths != null) ? day_lengths.length : 365;

        // Draw grid lines (gray)
        cr.set_source_rgba (0.5, 0.5, 0.5, 0.5);
        cr.set_line_width (1.0);
        // Horizontal grid lines (every 3 hours)
        for (int tick = 0; tick <= 24; tick += 3) {
            double y_val = margin_top + (plot_height * (1 - (tick - y_min) / (y_max - y_min)));
            cr.move_to (margin_left, y_val);
            cr.line_to (width - margin_right, y_val);
            cr.stroke ();
        }
        // Vertical grid lines (start of each month)
        for (int month = 1; month <= 12; month += 1) {
            DateTime month_start = new DateTime (new TimeZone.local (), current_year, month, 1, 0, 0, 0);
            int day_num = month_start.get_day_of_year ();
            double x_pos = margin_left + (plot_width * ((double) (day_num - 1) / (total_days - 1)));
            cr.move_to (x_pos, margin_top);
            cr.line_to (x_pos, height - margin_bottom);
            cr.stroke ();
        }

        // Draw axes (black, bold)
        cr.set_source_rgb (0, 0, 0);
        cr.set_line_width (2.0);
        // X axis
        cr.move_to (margin_left, height - margin_bottom);
        cr.line_to (width - margin_right, height - margin_bottom);
        cr.stroke ();
        // Y axis
        cr.move_to (margin_left, margin_top);
        cr.line_to (margin_left, height - margin_bottom);
        cr.stroke ();

        // Draw Y axis ticks
        cr.set_line_width (1.0);
        for (int tick = 0; tick <= 24; tick += 3) {
            double y_val = margin_top + (plot_height * (1 - (tick - y_min) / (y_max - y_min)));
            cr.move_to (margin_left - 5, y_val);
            cr.line_to (margin_left, y_val);
            cr.stroke ();
            // Draw tick labels
            cr.set_font_size (22);
            Cairo.TextExtents ext;
            cr.text_extents (tick.to_string (), out ext);
            cr.move_to (margin_left - 10 - ext.width, y_val + ext.height / 2);
            cr.show_text (tick.to_string ());
        }

        // Draw X axis ticks (start of each month)
        for (int month = 1; month <= 12; month += 1) {
            // Use GLib.DateTime to construct the 1st of each month
            DateTime month_start = new DateTime (new TimeZone.local (), current_year, month, 1, 0, 0, 0);
            int day_num = month_start.get_day_of_year ();
            double x_pos = margin_left + (plot_width * ((double) (day_num - 1) / (total_days - 1)));
            cr.move_to (x_pos, height - margin_bottom);
            cr.line_to (x_pos, height - margin_bottom + 5);
            cr.stroke ();
            // Draw month labels
            string label = month.to_string ();
            cr.set_font_size (22);
            Cairo.TextExtents ext;
            cr.text_extents (label, out ext);
            cr.move_to (x_pos - ext.width / 2, height - margin_bottom + 20);
            cr.show_text (label);
        }

        // Draw X and Y axis titles
        cr.set_source_rgb (0, 0, 0);
        cr.set_font_size (22);

        // X axis title
        string x_title = "Date (Month)";
        Cairo.TextExtents x_ext;
        cr.text_extents (x_title, out x_ext);
        cr.move_to ((double) width / 2 - x_ext.width / 2, height - margin_bottom + 50);
        cr.show_text (x_title);

        // Y axis title
        string y_title = "Day Length (hours)";
        Cairo.TextExtents y_ext;
        cr.text_extents (y_title, out y_ext);
        cr.save ();
        // Position 45 pixels to the left of Y axis, vertically centered
        cr.translate (margin_left - 45, (double) height / 2);
        // Rotate -90 degrees (π/2) for vertical text
        cr.rotate (-Math.PI / 2);
        // Adjust text position for vertical centering
        cr.move_to (-y_ext.width / 2, 0);
        cr.show_text (y_title);
        cr.restore ();

        // Add caption below the X axis title for clarity and aesthetics
        string caption;
        if (day_lengths == null) {
            caption = "Day Length";
        } else {
            caption = "Day Length - Latitude: %.2f°, Year: %d".printf (latitude_deg, current_year);
        }
        cr.set_font_size (22);
        Cairo.TextExtents cap_ext;
        cr.text_extents (caption, out cap_ext);
        cr.move_to ((width - cap_ext.width) / 2, (double) margin_top / 2);
        cr.show_text (caption);

        // Return if no data
        if (day_lengths == null) {
            return;
        }

        // Draw data curve (red, bold)
        cr.set_source_rgb (1, 0, 0);
        cr.set_line_width (2.5);
        for (int i = 0; i < total_days; i += 1) {
            double x = margin_left + (plot_width * ((double) i / (total_days - 1)));
            double y = margin_top + (plot_height * (1 - (day_lengths[i] - y_min) / (y_max - y_min)));
            if (i == 0) {
                cr.move_to (x, y);
            } else {
                cr.line_to (x, y);
            }
        }
        cr.stroke ();
    }

    /**
     * Exports the current day length plot to an image file (PNG or SVG).
     *
     * This function gets the current width and height of the drawing area.
     * If invalid, it defaults to 800x600.
     * It then creates a Cairo surface (SVG or PNG) and draws the plot onto it.
     *
     * @param filepath The destination file path.
     */
    private void export_plot (string filepath) {
        int width = drawing_area.get_width ();
        int height = drawing_area.get_height ();

        if (width <= 0 || height <= 0) {
            width = 800;
            height = 600;
        }

        string? extension = null;
        var last_dot = filepath.last_index_of_char ('.');
        if (last_dot != -1) {
            extension = filepath[last_dot:].down ();
        }

        if (extension == ".svg") {
            Cairo.SvgSurface surface = new Cairo.SvgSurface (filepath, width, height);
            Cairo.Context cr = new Cairo.Context (surface);
            draw_plot (drawing_area, cr, width, height);
        } else if (extension == ".pdf") {
            Cairo.PdfSurface surface = new Cairo.PdfSurface (filepath, width, height);
            Cairo.Context cr = new Cairo.Context (surface);
            draw_plot (drawing_area, cr, width, height);
        } else {
            Cairo.ImageSurface surface = new Cairo.ImageSurface (Cairo.Format.RGB24, width, height);
            Cairo.Context cr = new Cairo.Context (surface);
            draw_plot (drawing_area, cr, width, height);
            surface.write_to_png (filepath);
        }
    }
}

/**
 * Main application class for Day Length Plotter.
 */
public class DayLengthApp : Gtk.Application {

    /**
     * Constructs a new DayLengthApp.
     */
    public DayLengthApp () {
        Object (
            application_id: "com.github.wszqkzqk.DayLengthApp",
            flags: ApplicationFlags.DEFAULT_FLAGS
        );
    }

    /**
     * Activates the application.
     */
    protected override void activate () {
        var win = new DayLengthWindow (this);
        win.present ();
    }
}

/**
 * Main entry point.
 *
 * @param args Command line arguments.
 * @return Exit status code.
 */
public static int main (string[] args) {
    var app = new DayLengthApp ();
    return app.run (args);
}
编译与运行说明
- 文件最上方的 shebang 指定了编译命令,其包含了:
- 指定 Vala 编译器(
#!/usr/bin/env -S vala)。 - 添加 gtk4 包(
--pkg=gtk4)。 - 链接数学库 (
-lm)。 - 各种编译优化参数(如
-O2、-march=native等)。
- 指定 Vala 编译器(
- 运行前请确保系统已安装 Vala、GTK4 以及相关编译工具(如
gcc)。- 在 Arch Linux 上,可以使用以下命令安装所需的包:
sudo pacman -S --needed vala gtk4 - Windows 用户可以使用 MSYS2 环境,安装相关包:
pacman -S --needed mingw-w64-ucrt-x86_64-vala mingw-w64-ucrt-x86_64-gcc mingw-w64-ucrt-x86_64-gtk4
- 在 Arch Linux 上,可以使用以下命令安装所需的包:
- 可以直接执行该脚本,也可以在命令行中使用如下命令进行编译:
valac --pkg gtk4 -X -lm -X -pipe -X -O2 daylengthgtk.vala
GTK4应用:太阳高度角计算与绘制工具
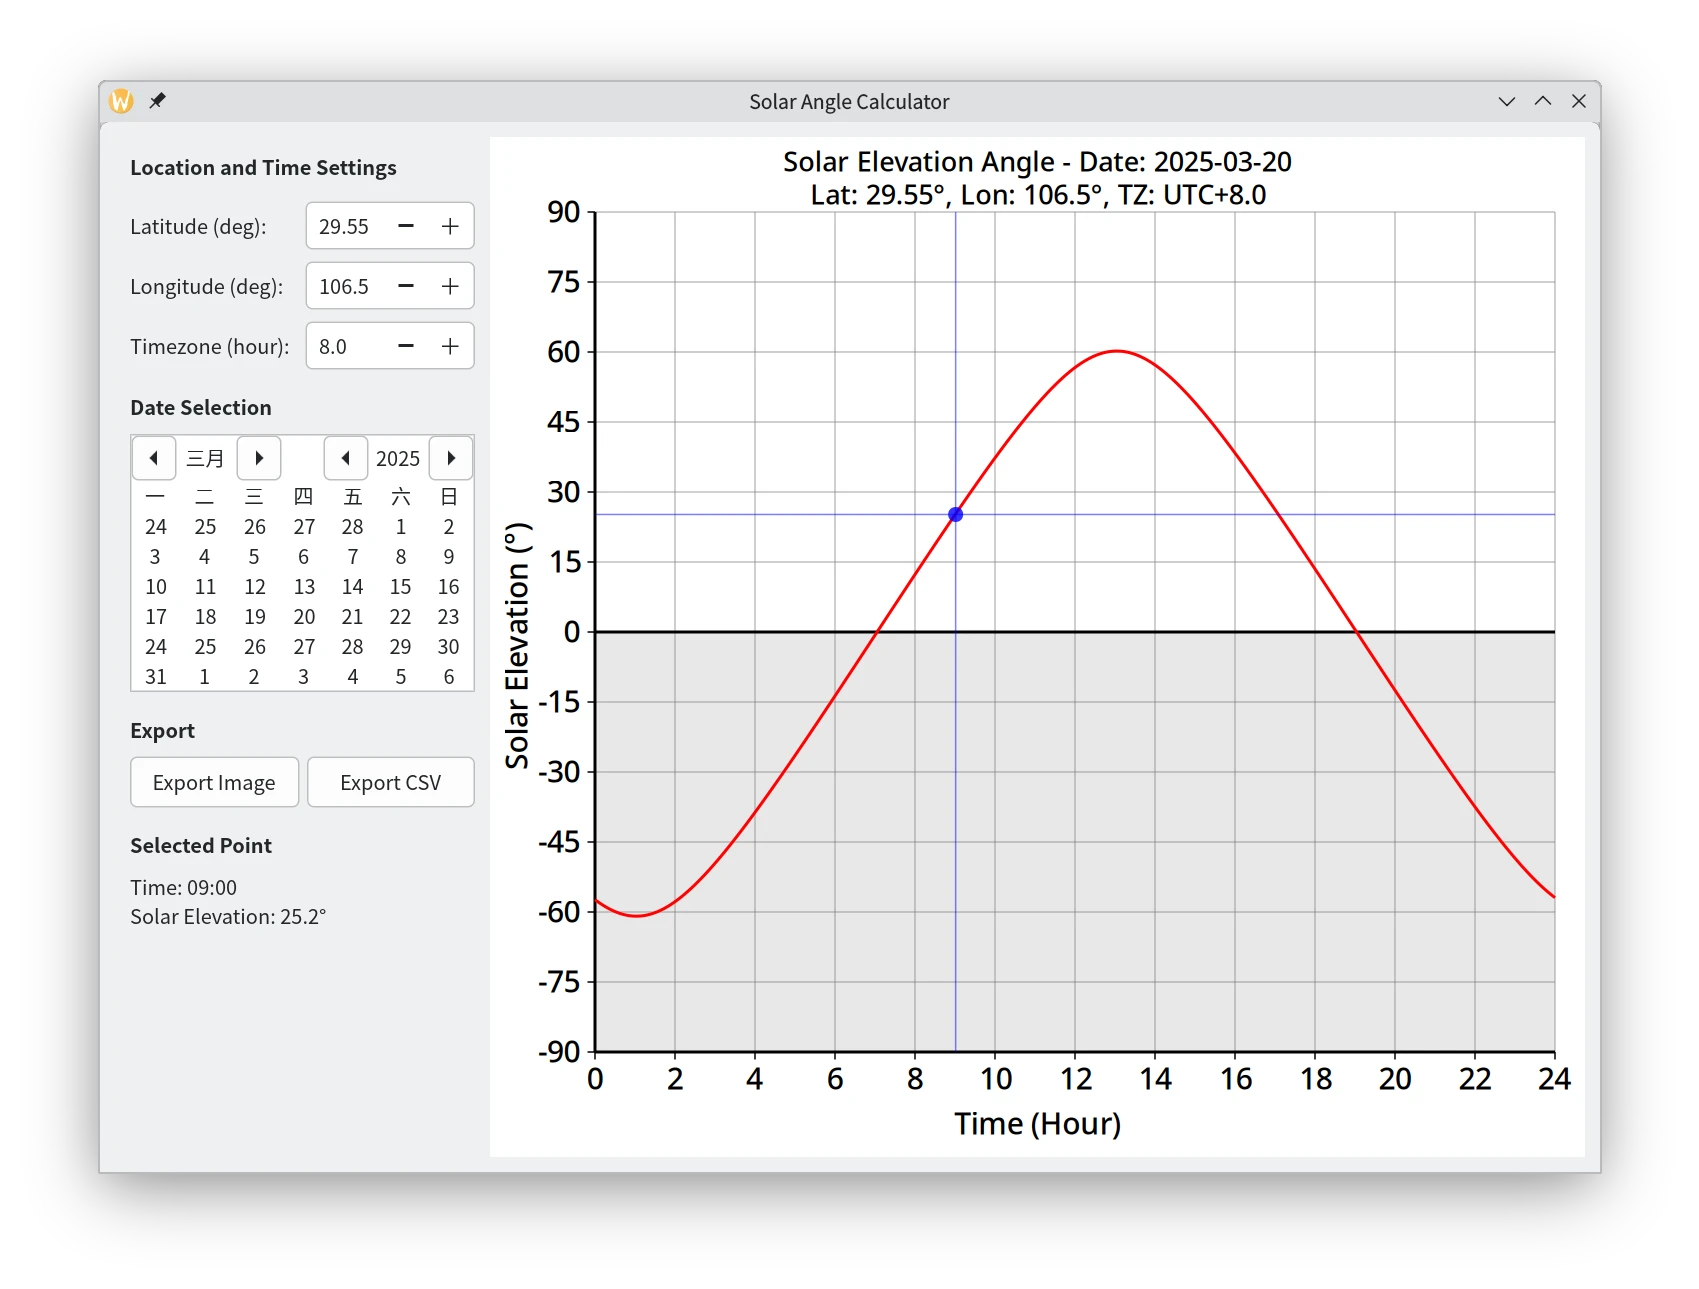
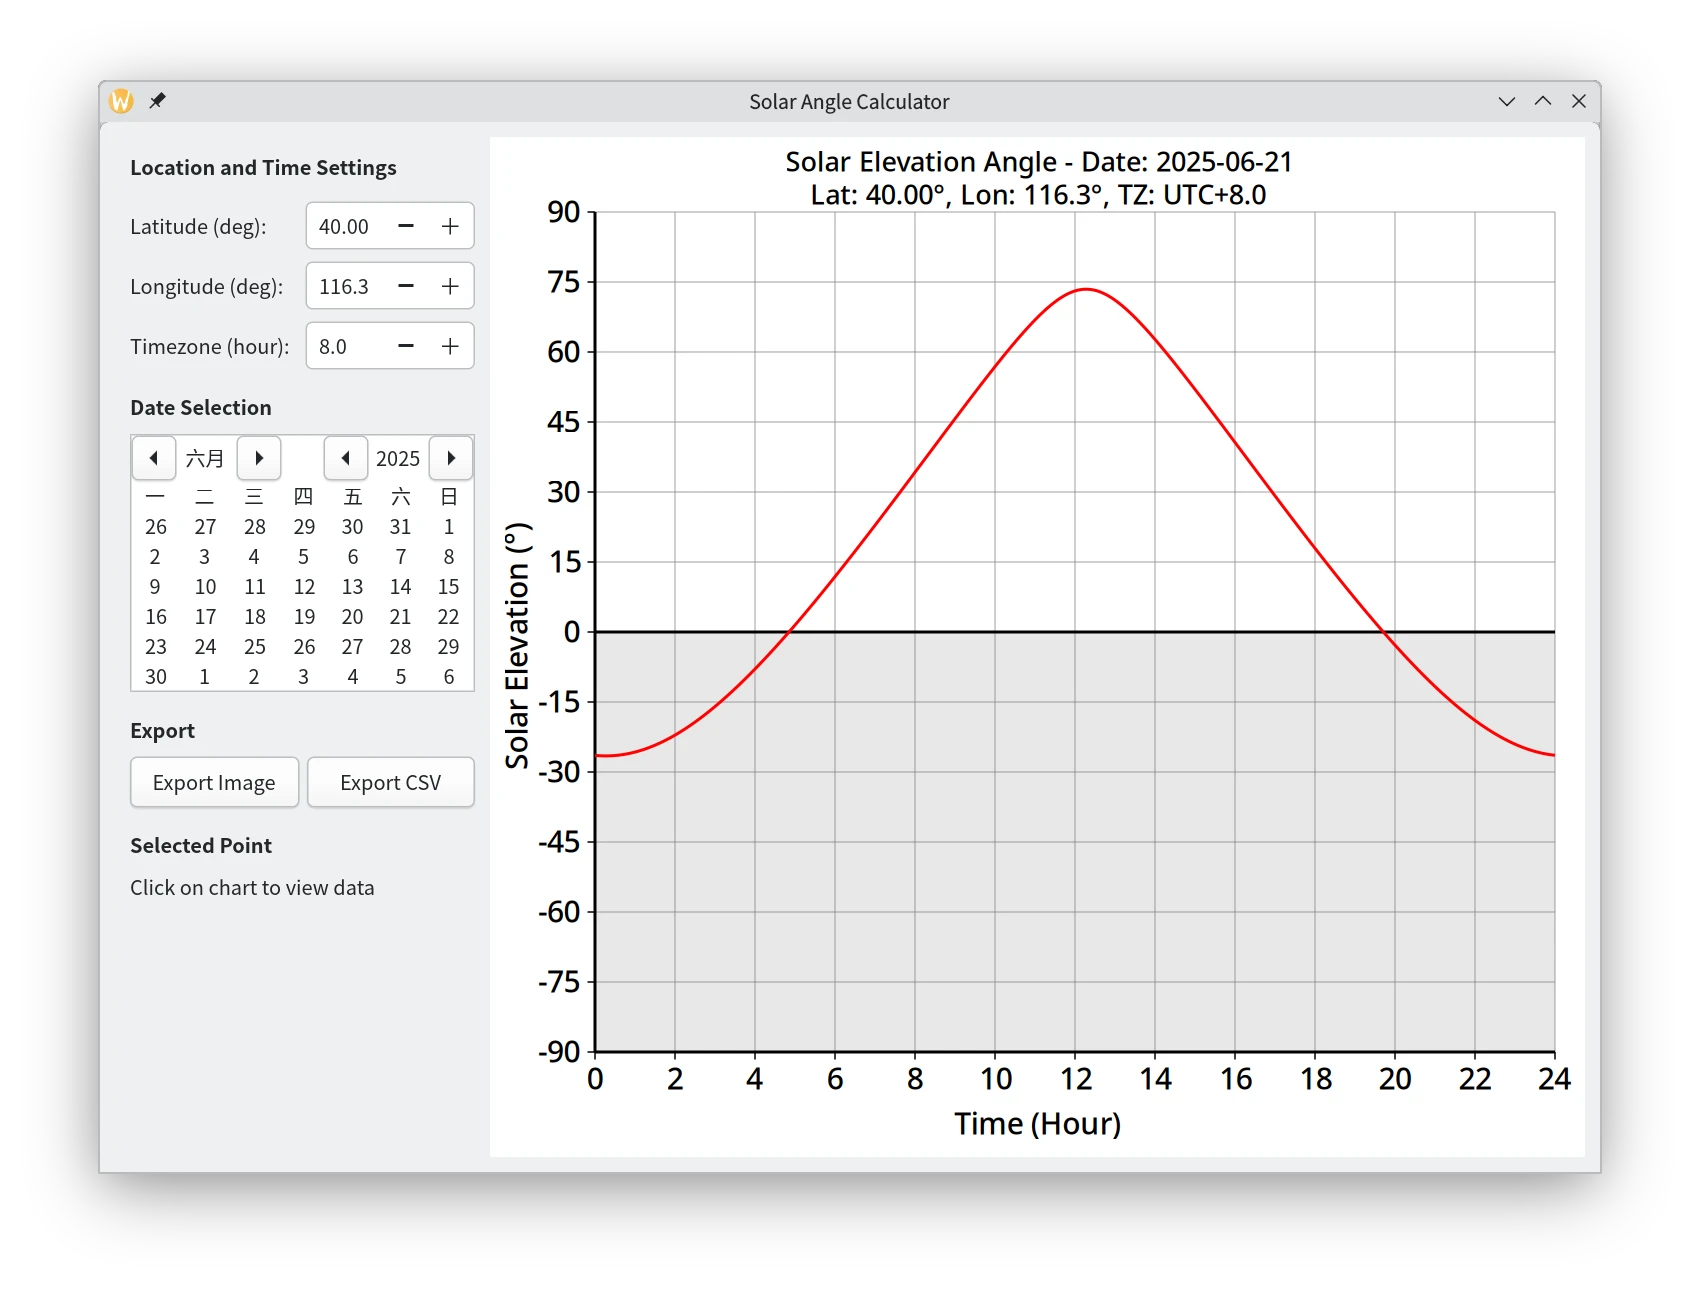
在了解了白昼时长计算程序后,我们再来看一个逻辑与布局更加复杂的 GTK4 应用程序。这个程序用于计算并绘制地球上任意位置(纬度、经度)、任意日期和时区下,太阳高度角随一天中时间变化的曲线。它将进一步展示 GTK4 中 Gtk.SpinButton、Gtk.Calendar、Gtk.GestureClick 和 Gtk.Grid 等组件的使用,以及 Cairo 绘图更精细的控制,例如绘制阴影区域、绘制点击位置的标记等。
为了达到更高的精度,程序现在使用更精确的NOAA赤纬公式来计算太阳赤纬角,该赤纬公式通过保留更多傅里叶级数项来提高精度。笔者还根据NOAA的这一文档,引入了均时差和真太阳时的计算,以更精确地确定太阳的实际位置。
该程序同样做了一些简化:
- 傅里叶级数的计算展开到 3 阶
- 相比于简单的几何模型,这包含了更多复杂的周期性变化
- 但仍无法考虑长期的岁差等效应
另外,在使用时需要注意:
- 本程序计算的是实际角度而非目测角度(显然目测角度无法包括地平线以下的状态)
- 角度本身是真实高度角,没有计入大气折射导致的视觉偏差
- 可以在实际应用时基于原始角度自行处理
- 例如,计算日出日落时间,地平线应当选择 -0.833 度而不是 0 度
- 笔者在按照该方法计算2025.06.02 - 2025.06.05北京与重庆的日出日落时间时,发现与当日天气预报给出的值完全一致(精确到分钟)
运行效果
 |
 |
|---|---|
| 重庆(北半球春分) | 北京(北半球夏至) |
 |
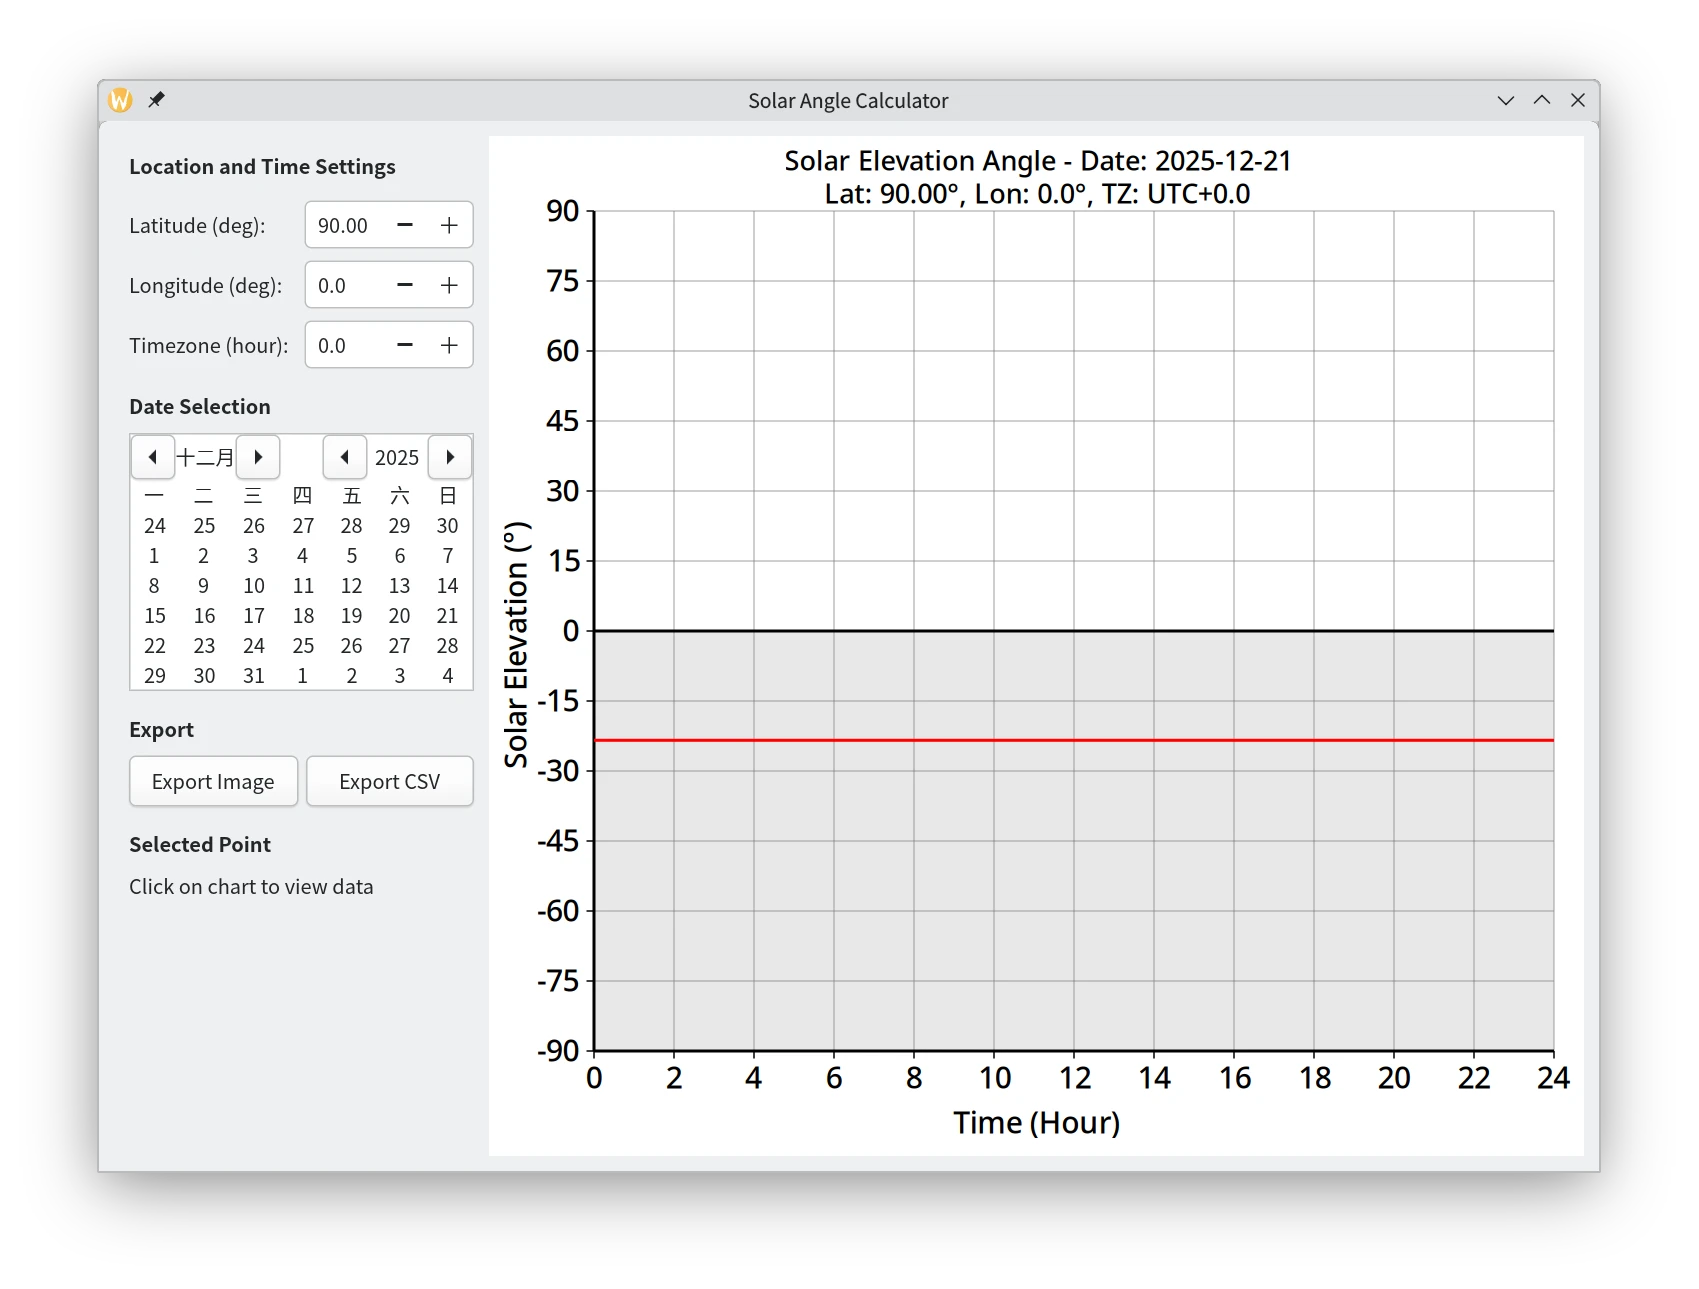 |
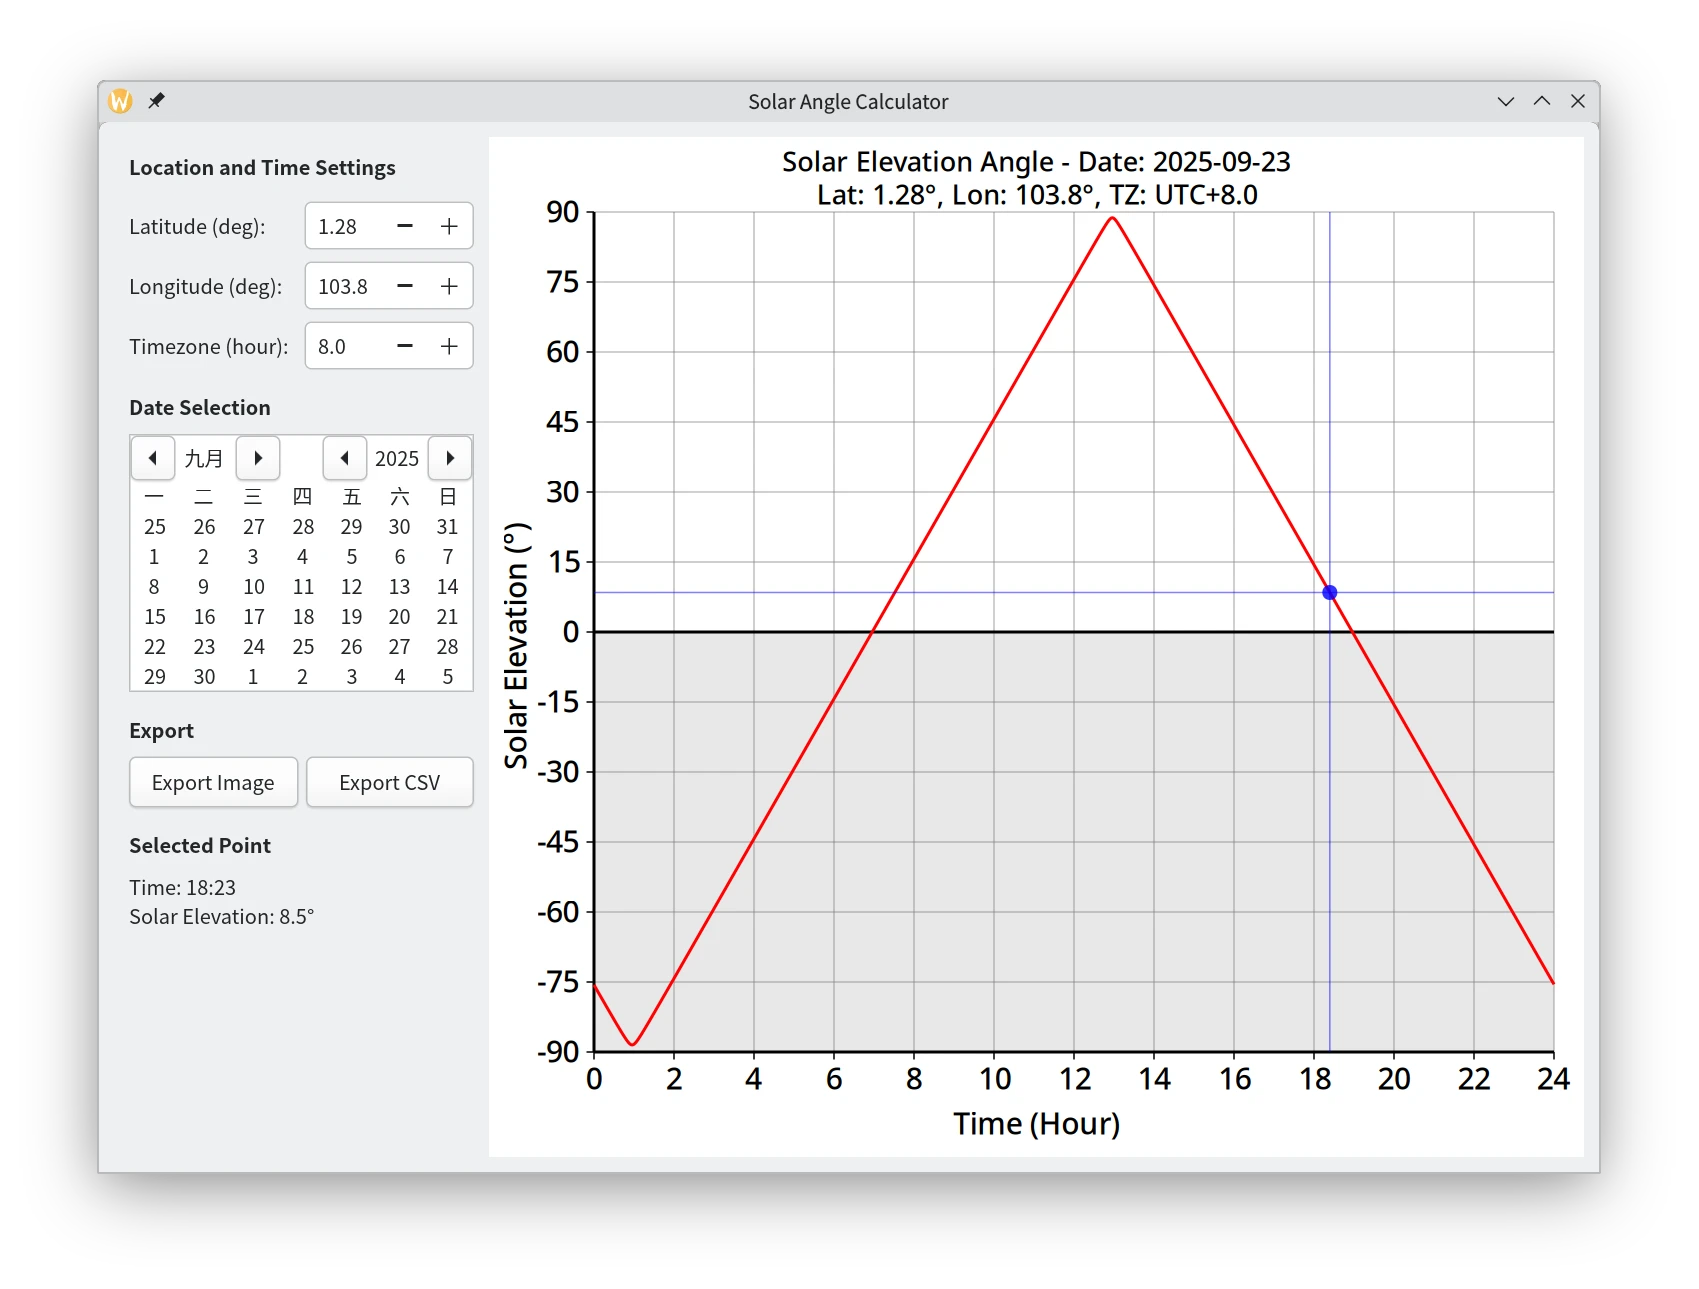
| 新加坡(北半球秋分) | 北极点(北半球冬至) |
程序架构
核心计算函数
generate_sun_angles (double latitude_rad, int day_of_year, int year, double longitude_deg, double timezone_offset_hrs)- 计算每日每分钟的太阳高度角。
- 日行轨迹组分与年角计算:
fractional_day_component = day_of_year - 1 + ((double) i) / RESOLUTION_PER_MIN:计算一年中的具体时刻(以天为单位,包含小数部分)。gamma_rad = (2.0 * Math.PI / days_in_year) * fractional_day_component:计算年角(弧度),表示地球在轨道上的精确位置。
-
太阳赤纬
\[\begin{aligned} \delta &= 0.006918 - 0.399912 \cos(\gamma) + 0.070257 \sin(\gamma) \\ &\quad - 0.006758 \cos(2 \times \gamma) + 0.000907 \sin(2 \times \gamma) \\ &\quad - 0.002697 \cos(3 \times \gamma) + 0.001480 \sin(3 \times \gamma) \end{aligned}\]δ计算(使用 NOAA 傅里叶级数近似公式): 将上述gamma_rad代入经验公式: - 均时差 (Equation of Time, EoT) 计算:
eqtime_minutes = 229.18 * (0.000075 + 0.001868 * cos(gamma_rad) ...):计算均时差(分钟),真太阳时(True Solar Time,基于太阳真实位置)与均太阳时(Mean Solar Time,假设太阳匀速运行)之差,主要由地球轨道偏心率和黄赤交角引起,反映钟表时间和日晷时间的偏差。将本地平时(分钟i)修正为真太阳时(分钟),以保证后续时角、太阳高度角计算的天文精度。- 真太阳时:基于太阳在天空中的实际位置计算。
- 平太阳时:虚构一个匀速运动的“平太阳”作为参考,将一天固定为24小时(86,400秒),消除季节性波动。这是日常钟表时间的基准。
- 真太阳日的长度(太阳连续两次过中天的时间间隔)会因地球轨道离心率和黄赤交角的影响而变化,可达±30秒。
- 这些微小日变化会逐日累积,导致真太阳时与平太阳时的偏差可达 -14分15秒至+16分25秒 (公元2000年),因此有必要均时差修正。
- 真太阳时 (True Solar Time, TST) 计算:
tst_minutes = i + eqtime_minutes + 4.0 * longitude_deg - 60.0 * timezone_offset_hrs
将本地钟表时间(分钟i)先加上均时差修正(eqtime_minutes),再加上因经度(每向东 1 度 +4 分钟)带来的分钟偏移,最后减去因时区带来的分钟差,得到真太阳时(分钟)。longitude_deg:经度(度),正值为东经、负值为西经;timezone_offset_hrs:时区偏移(小时),正值为东区、负值为西区;4.0 * longitude_deg:将经度转换为分钟偏移;60.0 * timezone_offset_hrs:将时区小时数转换为分钟偏移;
- 时角 (Hour Angle, HA) 计算:
ha_deg = (tst_minutes / 4.0) - 180.0:根据真太阳时计算时角(度),表示太阳相对于本地子午线的角距离。 - 太阳高度角计算:
使用球面三角公式,结合纬度
latitude_rad、太阳赤纬decl_rad和时角ha_rad计算太阳天顶角phi_rad,进而得到太阳高度角(90° - phi_rad)。 - 结果填充到
sun_angles数组(单位:°),每分钟一个采样点。
update_plot_data ()- 从
latitude_spin、longitude_spin、timezone_spin和calendar读取参数。 - 调用
generate_sun_angles更新太阳高度角数据。 - 清除任何先前在图表上选中的数据点信息(重置
has_click_point和click_info_label的文本)。
- 从
界面与事件处理
- 主布局:
main_box (Gtk.Box):依然使用Gtk.Box作为顶层水平布局容器,将界面分为左侧的控制面板和右侧的绘图区域。这种划分方式清晰直观。left_panel (Gtk.Box):左侧控制面板本身是一个垂直排列的Gtk.Box,用于组织纬度、经度、时区设置、日期选择、导出按钮和点击信息显示等多个控件组。设置hexpand = false确保左侧面板不会在水平方向上无限扩展,保持合适的宽度。
- 位置和时间设置:
- 网格布局
Gtk.Grid:对于纬度、经度和时区这三组“标签 + 输入框”的布局,笔者选择了Gtk.Grid(settings_grid)。相比于嵌套的Gtk.Box,Gtk.Grid提供了更强大和灵活的二维对齐方式。通过attach(child, column, row, width, height)方法,可以将子控件精确地放置在网格的指定单元格中,并可跨越多行或多列(这里仅使用了单行单列)。column_spacing和row_spacing属性用于设置单元格之间的间距,使布局更加规整美观。 - 数字输入
Gtk.SpinButton:纬度、经度和时区均使用Gtk.SpinButton进行输入。Gtk.SpinButton专门用于输入有范围限制的数值,用户可以通过点击上下箭头或直接输入来改变值。Gtk.SpinButton.with_range(min, max, step)是其常用的构造函数,分别设置最小值、最大值和步长。纬度范围是 [-90, 90],步长 0.1;经度范围是 [-180, 180],步长 1.0;时区范围是 [-12, 14],步长 0.5。用户也可以手动输入更精确的值,并不一定要遵循步长的整数倍。digits属性用于控制显示的小数位数。- 其
value_changed信号在数值发生改变时触发,笔者连接此信号到回调函数,以实时更新图表数据并重绘。
- 网格布局
- 日期选择:
- 日历控件
Gtk.Calendar(calendar):提供了一个标准的日历视图,允许用户方便地选择日期。 day_selected信号在用户点击并选择一个新的日期时发出。笔者连接此信号到回调函数,当日期改变时,更新图表数据并重绘。calendar.get_date()用于获取当前选中的DateTime对象。
- 日历控件
- 导出:
- “Export Image”按钮 (
export_button) 和 “Export CSV”按钮 (export_csv_button):与前一个例子类似,使用Gtk.Button。点击后均通过Gtk.FileDialog弹出文件保存对话框。- 图像导出支持 PNG, SVG, PDF 格式,通过
Gtk.FileFilter实现。 - CSV 导出则只提供 CSV 格式的过滤器。
- 图像导出支持 PNG, SVG, PDF 格式,通过
- 导出逻辑封装在
export_chart (file)和export_csv_data (file)方法中。
- “Export Image”按钮 (
- 图表交互:
- 手势控制器
Gtk.GestureClick:使用手势(Gesture)系统来处理输入事件。笔者将一个Gtk.GestureClick控制器附加到drawing_area上,以捕获鼠标点击事件。 click_controller.pressed.connect(on_chart_clicked):当用户在drawing_area上按下鼠标按钮时(手势开始时),pressed信号会发出,并调用on_chart_clicked回调函数。此回调函数接收按下次數 (n_press) 以及点击位置的x、y坐标。on_chart_clicked (int n_press, double x, double y)回调函数:- 首先判断点击是否在绘图区域内且为单击 (
n_press == 1)。 - 如果是有效单击,则根据点击的
x坐标计算对应的时间浮点数(小时),存储到clicked_time_hours。 - 计算出对应的分钟索引(
time_minutes),并从sun_angles数组中获取该时间点的太阳高度角,存储到corresponding_angle。 - 设置
has_click_point = true。 - 在
click_info_label(一个Gtk.Label) 中显示格式化后的时间和太阳高度角信息。 - 调用
drawing_area.queue_draw()请求重绘,以便在图表上显示标记点和辅助线。 - 如果是双击或在绘图区域外点击,则清除选中的数据点信息(设置
has_click_point = false,重置click_info_label的文本),并重绘图表。
- 首先判断点击是否在绘图区域内且为单击 (
- 手势控制器
activate()方法:- 此方法负责在应用启动时构建整个用户界面。
- 初始化所有UI组件,包括各种
Gtk.Box、Gtk.Grid、Gtk.Label、Gtk.SpinButton、Gtk.Calendar、Gtk.Button和Gtk.DrawingArea。 - 创建并配置
Gtk.GestureClick控制器,将其pressed信号连接到on_chart_clicked回调函数,然后通过drawing_area.add_controller(click_controller)将手势控制器添加到绘图区域,使其能够响应点击事件。 - 最后,将主布局
main_box设置为窗口的子控件,并调用window.present()显示窗口。
绘图函数
draw_sun_angle_chart (Gtk.DrawingArea, Cairo.Context, int width, int height):- 绘制白色背景。
- 绘制半透明灰色阴影矩形表示地平线以下区域。
- 绘制网格线:水平线间隔 15° 高度角,垂直线间隔 2 小时。
- 绘制坐标轴、刻度标记和数字标签。
- 使用红色曲线绘制计算得到的太阳高度角随时间变化。
- 如果
has_click_point为true:- 根据存储的
clicked_time_hours和corresponding_angle计算标记点的 x 和 y 坐标。 - 在标记点处绘制一个蓝色圆点。
- 从标记点向图表的顶部和底部绘制一条半透明的蓝色垂直线。
- 从标记点向图表的左侧和右侧绘制一条半透明的蓝色水平线。
- 根据存储的
- 在图表顶部绘制标题,分两行显示当前选择的日期、纬度、经度和时区。
实现代码
实现这个应用程序的代码如下:
#!/usr/bin/env -S vala --pkg=gtk4 -X -lm -X -O2 -X -march=native -X -pipe

/**
 * Solar Angle Calculator Application.
 *
 * A GTK4 application that calculates and visualizes solar elevation angles
 * throughout the day for a given location and date. The application provides
 * an interactive interface for setting latitude, longitude, timezone, and date,
 * and displays a real-time chart of solar elevation angles with export capabilities.
 */
public class SolarAngleApp : Gtk.Application {
    // Constants for solar angle calculations
    private const double DEG2RAD = Math.PI / 180.0;
    private const double RAD2DEG = 180.0 / Math.PI;
    private const int RESOLUTION_PER_MIN = 1440; // 1 sample per minute
    // Constants for margins in the drawing area
    private const int MARGIN_LEFT = 70;
    private const int MARGIN_RIGHT = 20;
    private const int MARGIN_TOP = 50;
    private const int MARGIN_BOTTOM = 70;

    private Gtk.ApplicationWindow window;
    private Gtk.DrawingArea drawing_area;
    private Gtk.Label click_info_label;
    private DateTime selected_date;
    private double sun_angles[RESOLUTION_PER_MIN];
    private double latitude = 0.0;
    private double longitude = 0.0;
    private double timezone_offset_hours = 0.0;
    private double clicked_time_hours = 0.0;
    private double corresponding_angle = 0.0;
    private bool has_click_point = false;

    /**
     * Creates a new SolarAngleApp instance.
     *
     * Initializes the application with a unique application ID and sets
     * the selected date to the current local date.
     */
    public SolarAngleApp () {
        Object (application_id: "com.github.wszqkzqk.SolarAngleGtk");
        selected_date = new DateTime.now_local ();
    }

    /**
     * Activates the application and creates the main window.
     *
     * Sets up the user interface including input controls, drawing area,
     * and initializes the plot data with current settings.
     */
    protected override void activate () {
        window = new Gtk.ApplicationWindow (this) {
            title = "Solar Angle Calculator",
            default_width = 1000,
            default_height = 700,
        };

        var main_box = new Gtk.Box (Gtk.Orientation.HORIZONTAL, 0);

        var left_panel = new Gtk.Box (Gtk.Orientation.VERTICAL, 15) {
            hexpand = false,
            margin_start = 10,
            margin_end = 10,
            margin_top = 10,
            margin_bottom = 10,
        };

        var location_time_group = new Gtk.Box (Gtk.Orientation.VERTICAL, 8);
        var location_time_label = new Gtk.Label ("<b>Location and Time Settings</b>") {
            use_markup = true,
            halign = Gtk.Align.START,
        };
        location_time_group.append (location_time_label);

        var settings_grid = new Gtk.Grid () {
            column_spacing = 10,
            row_spacing = 8,
            margin_top = 5,
        };

        var latitude_label = new Gtk.Label ("Latitude (deg):") {
            halign = Gtk.Align.START,
        };
        var latitude_spin = new Gtk.SpinButton.with_range (-90, 90, 0.1) {
            value = latitude,
            digits = 2,
        };
        latitude_spin.value_changed.connect (() => {
            latitude = latitude_spin.value;
            update_plot_data ();
            drawing_area.queue_draw ();
        });

        var longitude_label = new Gtk.Label ("Longitude (deg):") {
            halign = Gtk.Align.START,
        };
        var longitude_spin = new Gtk.SpinButton.with_range (-180.0, 180.0, 0.1) {
            value = longitude,
            digits = 2,
        };
        longitude_spin.value_changed.connect (() => {
            longitude = longitude_spin.value;
            update_plot_data ();
            drawing_area.queue_draw ();
        });

        var timezone_label = new Gtk.Label ("Timezone (hour):") {
            halign = Gtk.Align.START,
        };
        var timezone_spin = new Gtk.SpinButton.with_range (-12.0, 14.0, 0.5) {
            value = timezone_offset_hours,
            digits = 2,
        };
        timezone_spin.value_changed.connect (() => {
            timezone_offset_hours = timezone_spin.value;
            update_plot_data ();
            drawing_area.queue_draw ();
        });

        settings_grid.attach (latitude_label, 0, 0, 1, 1);
        settings_grid.attach (latitude_spin, 1, 0, 1, 1);
        settings_grid.attach (longitude_label, 0, 1, 1, 1);
        settings_grid.attach (longitude_spin, 1, 1, 1, 1);
        settings_grid.attach (timezone_label, 0, 2, 1, 1);
        settings_grid.attach (timezone_spin, 1, 2, 1, 1);

        location_time_group.append (settings_grid);

        var date_group = new Gtk.Box (Gtk.Orientation.VERTICAL, 8);
        var date_label = new Gtk.Label ("<b>Date Selection</b>") {
            use_markup = true,
            halign = Gtk.Align.START,
        };
        var calendar = new Gtk.Calendar ();
        calendar.day_selected.connect (() => {
            selected_date = calendar.get_date ();
            update_plot_data ();
            drawing_area.queue_draw ();
        });

        date_group.append (date_label);
        date_group.append (calendar);

        var export_group = new Gtk.Box (Gtk.Orientation.VERTICAL, 8);
        var export_label = new Gtk.Label ("<b>Export</b>") {
            use_markup = true,
            halign = Gtk.Align.START,
        };

        // Create horizontal box for buttons
        var export_buttons_box = new Gtk.Box (Gtk.Orientation.HORIZONTAL, 5) {
            homogeneous = true,
        };

        var export_button = new Gtk.Button.with_label ("Export Image");
        export_button.clicked.connect (on_export_clicked);

        var export_csv_button = new Gtk.Button.with_label ("Export CSV");
        export_csv_button.clicked.connect (on_export_csv_clicked);

        export_buttons_box.append (export_button);
        export_buttons_box.append (export_csv_button);

        export_group.append (export_label);
        export_group.append (export_buttons_box);

        // Add click info display group
        var click_info_group = new Gtk.Box (Gtk.Orientation.VERTICAL, 8);
        var click_info_title = new Gtk.Label ("<b>Selected Point</b>") {
            use_markup = true,
            halign = Gtk.Align.START,
        };
        // Initial click info label (Use an extra newline for better spacing)
        click_info_label = new Gtk.Label ("Click on chart to view data\n") {
            halign = Gtk.Align.START,
        };
        click_info_group.append (click_info_title);
        click_info_group.append (click_info_label);

        left_panel.append (location_time_group);
        left_panel.append (date_group);
        left_panel.append (export_group);
        left_panel.append (click_info_group);

        drawing_area = new Gtk.DrawingArea () {
            hexpand = true,
            vexpand = true,
            width_request = 600,
            height_request = 500,
        };
        drawing_area.set_draw_func (draw_sun_angle_chart);

        // Add click event controller
        var click_controller = new Gtk.GestureClick ();
        click_controller.pressed.connect (on_chart_clicked);
        drawing_area.add_controller (click_controller);

        main_box.append (left_panel);
        main_box.append (drawing_area);

        update_plot_data ();

        window.child = main_box;
        window.present ();
    }

    /**
     * Calculates solar elevation angles for each minute of the day.
     *
     * @param latitude_rad Latitude in radians.
     * @param day_of_year Day of the year (1-365/366).
     * @param year The year.
     * @param longitude_deg Longitude in degrees.
     * @param timezone_offset_hrs Timezone offset from UTC in hours.
     */
    private void generate_sun_angles (double latitude_rad, int day_of_year, int year, double longitude_deg, double timezone_offset_hrs) {
        double sin_lat = Math.sin (latitude_rad);
        double cos_lat = Math.cos (latitude_rad);

        double days_in_year = ((year % 4 == 0) && ((year % 100 != 0) || (year % 400 == 0))) ? 366.0 : 365.0;

        for (int i = 0; i < RESOLUTION_PER_MIN; i += 1) {
            // fractional_day_component: day of year plus fraction of the day
            double fractional_day_component = day_of_year - 1 + ((double) i) / RESOLUTION_PER_MIN;
            // gamma: fractional year angle in radians
            double gamma_rad = (2.0 * Math.PI / days_in_year) * fractional_day_component;

            // Solar declination delta (rad) via Fourier series approximation
            double decl_rad = 0.006918
                - 0.399912 * Math.cos (gamma_rad)
                + 0.070257 * Math.sin (gamma_rad)
                - 0.006758 * Math.cos (2.0 * gamma_rad)
                + 0.000907 * Math.sin (2.0 * gamma_rad)
                - 0.002697 * Math.cos (3.0 * gamma_rad)
                + 0.001480 * Math.sin (3.0 * gamma_rad);

            // Equation of Time (EoT) in minutes
            double eqtime_minutes = 229.18 * (0.000075
                + 0.001868 * Math.cos (gamma_rad)
                - 0.032077 * Math.sin (gamma_rad)
                - 0.014615 * Math.cos (2.0 * gamma_rad)
                - 0.040849 * Math.sin (2.0 * gamma_rad));

            // True Solar Time (TST) in minutes, correcting local clock by EoT and longitude
            double tst_minutes = i + eqtime_minutes + 4.0 * longitude_deg - 60.0 * timezone_offset_hrs;

            // Hour angle H (°) relative to solar noon
            double ha_deg = tst_minutes / 4.0 - 180.0;
            double ha_rad = ha_deg * DEG2RAD;

            // cos(phi): cosine of zenith angle via spherical trig
            double cos_phi = sin_lat * Math.sin (decl_rad) + cos_lat * Math.cos (decl_rad) * Math.cos (ha_rad);
            // clamp to valid range
            if (cos_phi > 1.0) cos_phi = 1.0;
            if (cos_phi < -1.0) cos_phi = -1.0;
            // Zenith angle phi (rad)
            double phi_rad = Math.acos (cos_phi);

            // Solar elevation alpha = 90° - phi, convert to degrees
            double solar_elevation_rad = Math.PI / 2.0 - phi_rad;
            sun_angles[i] = solar_elevation_rad * RAD2DEG;
        }
    }

    /**
     * Updates solar angle data for current settings.
     */
    private void update_plot_data () {
        int day_of_year = selected_date.get_day_of_year ();
        double latitude_rad = latitude * DEG2RAD;
        int year = selected_date.get_year ();
        generate_sun_angles (latitude_rad, day_of_year, year, longitude, timezone_offset_hours);

        // Clear click point when data updates
        has_click_point = false;
        click_info_label.label = "Click on chart to view data\n";
    }

    /**
     * Handles mouse click events on the chart.
     *
     * @param n_press Number of button presses.
     * @param x X coordinate of the click.
     * @param y Y coordinate of the click.
     */
    private void on_chart_clicked (int n_press, double x, double y) {
        int width = drawing_area.get_width ();
        int height = drawing_area.get_height ();

        int chart_width = width - MARGIN_LEFT - MARGIN_RIGHT;

        // Check if click is within plot area and single click
        if (x >= MARGIN_LEFT && x <= width - MARGIN_RIGHT && y >= MARGIN_TOP && y <= height - MARGIN_BOTTOM && n_press == 1) {
            // Convert coordinates to time and get corresponding angle
            clicked_time_hours = (x - MARGIN_LEFT) / chart_width * 24.0;
            int time_minutes = (int) (clicked_time_hours * 60) % RESOLUTION_PER_MIN;
            corresponding_angle = sun_angles[time_minutes];
            has_click_point = true;

            // Format time display
            int hours = (int) clicked_time_hours;
            int minutes = (int) ((clicked_time_hours - hours) * 60);

            // Update info label
            string info_text = "Time: %02d:%02d\nSolar Elevation: %.1f°".printf (
                hours, minutes, corresponding_angle
            );

            click_info_label.label = info_text;
            drawing_area.queue_draw ();
        } else {
            // Double click or outside plot area - clear point
            has_click_point = false;
            click_info_label.label = "Click on chart to view data\n";
            drawing_area.queue_draw ();
        }
    }

    /**
     * Draws the solar elevation chart.
     *
     * @param area The drawing area widget.
     * @param cr The Cairo context for drawing.
     * @param width The width of the drawing area.
     * @param height The height of the drawing area.
     */
    private void draw_sun_angle_chart (Gtk.DrawingArea area, Cairo.Context cr, int width, int height) {
        // Fill background
        cr.set_source_rgb (1, 1, 1);
        cr.paint ();

        int chart_width = width - MARGIN_LEFT - MARGIN_RIGHT;
        int chart_height = height - MARGIN_TOP - MARGIN_BOTTOM;

        double horizon_y = MARGIN_TOP + chart_height * 0.5; // 0° is at middle of -90° to +90° range

        // Shade area below horizon
        cr.set_source_rgba (0.7, 0.7, 0.7, 0.3);
        cr.rectangle (MARGIN_LEFT, horizon_y, chart_width, height - MARGIN_BOTTOM - horizon_y);
        cr.fill ();

        // Draw horizontal grid every 15°
        cr.set_source_rgba (0.5, 0.5, 0.5, 0.5);
        cr.set_line_width (1);
        for (int angle = -90; angle <= 90; angle += 15) {
            double tick_y = MARGIN_TOP + chart_height * (90 - angle) / 180.0;
            cr.move_to (MARGIN_LEFT, tick_y);
            cr.line_to (width - MARGIN_RIGHT, tick_y);
            cr.stroke ();
        }
        // Draw vertical grid every 2 hours
        for (int h = 0; h <= 24; h += 2) {
            double tick_x = MARGIN_LEFT + chart_width * (h / 24.0);
            cr.move_to (tick_x, MARGIN_TOP);
            cr.line_to (tick_x, height - MARGIN_BOTTOM);
            cr.stroke ();
        }

        // Draw axes and horizon
        cr.set_source_rgb (0, 0, 0);
        cr.set_line_width (2);
        cr.move_to (MARGIN_LEFT, height - MARGIN_BOTTOM);
        cr.line_to (width - MARGIN_RIGHT, height - MARGIN_BOTTOM);
        cr.stroke ();
        cr.move_to (MARGIN_LEFT, MARGIN_TOP);
        cr.line_to (MARGIN_LEFT, height - MARGIN_BOTTOM);
        cr.stroke ();
        // Horizon line
        cr.move_to (MARGIN_LEFT, horizon_y);
        cr.line_to (width - MARGIN_RIGHT, horizon_y);
        cr.stroke ();

        // Draw axis ticks and labels
        cr.set_line_width (1);
        cr.set_font_size (20);
        for (int angle = -90; angle <= 90; angle += 15) {
            double tick_y = MARGIN_TOP + chart_height * (90 - angle) / 180.0;
            cr.move_to (MARGIN_LEFT - 5, tick_y);
            cr.line_to (MARGIN_LEFT, tick_y);
            cr.stroke ();
            var te = Cairo.TextExtents ();
            var txt = angle.to_string ();
            cr.text_extents (txt, out te);
            cr.move_to (MARGIN_LEFT - 10 - te.width, tick_y + te.height / 2);
            cr.show_text (txt);
        }
        for (int h = 0; h <= 24; h += 2) {
            double tick_x = MARGIN_LEFT + chart_width * (h / 24.0);
            cr.move_to (tick_x, height - MARGIN_BOTTOM);
            cr.line_to (tick_x, height - MARGIN_BOTTOM + 5);
            cr.stroke ();
            var te = Cairo.TextExtents ();
            var txt = h.to_string ();
            cr.text_extents (txt, out te);
            cr.move_to (tick_x - te.width / 2, height - MARGIN_BOTTOM + 25);
            cr.show_text (txt);
        }

        // Plot solar elevation curve
        cr.set_source_rgb (1, 0, 0);
        cr.set_line_width (2);
        for (int i = 0; i < RESOLUTION_PER_MIN; i += 1) {
            double x = MARGIN_LEFT + chart_width * (i / (double) (RESOLUTION_PER_MIN - 1));
            double y = MARGIN_TOP + chart_height * (90.0 - sun_angles[i]) / 180.0;
            if (i == 0) {
                cr.move_to (x, y);
            } else {
                cr.line_to (x, y);
            }
        }
        cr.stroke ();

        // Draw click point if exists
        if (has_click_point) {
            // Calculate current coordinates from stored time and angle
            double clicked_x = MARGIN_LEFT + chart_width * (clicked_time_hours / 24.0);
            double corresponding_y = MARGIN_TOP + chart_height * (90.0 - corresponding_angle) / 180.0;

            cr.set_source_rgba (0, 0, 1, 0.8);
            cr.arc (clicked_x, corresponding_y, 5, 0, 2 * Math.PI);
            cr.fill ();

            // Draw vertical line to show time
            cr.set_source_rgba (0, 0, 1, 0.5);
            cr.set_line_width (1);
            cr.move_to (clicked_x, MARGIN_TOP);
            cr.line_to (clicked_x, height - MARGIN_BOTTOM);
            cr.stroke ();

            // Draw horizontal line to show angle
            cr.move_to (MARGIN_LEFT, corresponding_y);
            cr.line_to (width - MARGIN_RIGHT, corresponding_y);
            cr.stroke ();
        }

        // Draw axis titles
        cr.set_source_rgb (0, 0, 0);
        cr.set_font_size (20);
        string x_title = "Time (Hour)";
        Cairo.TextExtents x_ext;
        cr.text_extents (x_title, out x_ext);
        cr.move_to ((double) width / 2 - x_ext.width / 2, height - MARGIN_BOTTOM + 55);
        cr.show_text (x_title);
        string y_title = "Solar Elevation (°)";
        Cairo.TextExtents y_ext;
        cr.text_extents (y_title, out y_ext);
        cr.save ();
        cr.translate (MARGIN_LEFT - 45, (double)height / 2);
        cr.rotate (-Math.PI / 2);
        cr.move_to (-y_ext.width / 2, 0);
        cr.show_text (y_title);
        cr.restore ();

        // Draw chart captions
        string caption_line1 = "Solar Elevation Angle - Date: %s".printf (selected_date.format ("%Y-%m-%d"));
        string caption_line2 = "Lat: %.2f°, Lon: %.2f°, TZ: UTC%+.2f".printf (latitude, longitude, timezone_offset_hours);

        cr.set_font_size (18);
        Cairo.TextExtents cap_ext1, cap_ext2;
        cr.text_extents (caption_line1, out cap_ext1);
        cr.text_extents (caption_line2, out cap_ext2);

        double total_caption_height = cap_ext1.height + cap_ext2.height + 5;

        cr.move_to ((width - cap_ext1.width) / 2, (MARGIN_TOP - total_caption_height) / 2 + cap_ext1.height);
        cr.show_text (caption_line1);
        cr.move_to ((width - cap_ext2.width) / 2, (MARGIN_TOP - total_caption_height) / 2 + cap_ext1.height + 5 + cap_ext2.height);
        cr.show_text (caption_line2);
    }

    /**
     * Handles export button click event.
     *
     * Shows a file save dialog with filters for PNG, SVG, and PDF formats.
     */
    private void on_export_clicked () {
        // Show save dialog with PNG, SVG, PDF filters
        var png_filter = new Gtk.FileFilter ();
        png_filter.name = "PNG Images";
        png_filter.add_mime_type ("image/png");

        var svg_filter = new Gtk.FileFilter ();
        svg_filter.name = "SVG Images";
        svg_filter.add_mime_type ("image/svg+xml");

        var pdf_filter = new Gtk.FileFilter ();
        pdf_filter.name = "PDF Documents";
        pdf_filter.add_mime_type ("application/pdf");

        var filter_list = new ListStore (typeof (Gtk.FileFilter));
        filter_list.append (png_filter);
        filter_list.append (svg_filter);
        filter_list.append (pdf_filter);

        var file_dialog = new Gtk.FileDialog () {
            modal = true,
            initial_name = "solar_elevation_chart.png",
            filters = filter_list,
        };

        file_dialog.save.begin (window, null, (obj, res) => {
            try {
                var file = file_dialog.save.end (res);
                if (file != null) {
                    export_chart (file);
                }
            } catch (Error e) {
                message ("Image file has not been saved: %s", e.message);
            }
        });
    }

    /**
     * Exports the current chart to a file.
     *
     * Supports PNG, SVG, and PDF formats based on file extension.
     * Defaults to PNG if extension is not recognized.
     *
     * @param file The file to export the chart to.
     */
    private void export_chart (File file) {
        int width = drawing_area.get_width ();
        int height = drawing_area.get_height ();

        if (width <= 0 || height <= 0) {
            width = 800;
            height = 600;
        }

        string filepath = file.get_path ();
        string? extension = null;
        var last_dot = filepath.last_index_of_char ('.');
        if (last_dot != -1) {
            extension = filepath[last_dot:].down ();
        }

        if (extension == ".svg") {
            Cairo.SvgSurface surface = new Cairo.SvgSurface (filepath, width, height);
            Cairo.Context cr = new Cairo.Context (surface);
            draw_sun_angle_chart (drawing_area, cr, width, height);
        } else if (extension == ".pdf") {
            Cairo.PdfSurface surface = new Cairo.PdfSurface (filepath, width, height);
            Cairo.Context cr = new Cairo.Context (surface);
            draw_sun_angle_chart (drawing_area, cr, width, height);
        } else {
            Cairo.ImageSurface surface = new Cairo.ImageSurface (Cairo.Format.RGB24, width, height);
            Cairo.Context cr = new Cairo.Context (surface);
            draw_sun_angle_chart (drawing_area, cr, width, height);
            surface.write_to_png (filepath);
        }
    }

    /**
     * Handles CSV export button click event.
     *
     * Shows a file save dialog for CSV format.
     */
    private void on_export_csv_clicked () {
        var csv_filter = new Gtk.FileFilter ();
        csv_filter.name = "CSV Files";
        csv_filter.add_mime_type ("text/csv");

        var filter_list = new ListStore (typeof (Gtk.FileFilter));
        filter_list.append (csv_filter);

        var file_dialog = new Gtk.FileDialog () {
            modal = true,
            initial_name = "solar_elevation_data.csv",
            filters = filter_list,
        };

        file_dialog.save.begin (window, null, (obj, res) => {
            try {
                var file = file_dialog.save.end (res);
                if (file != null) {
                    export_csv_data (file);
                }
            } catch (Error e) {
                message ("CSV file has not been saved: %s", e.message);
            }
        });
    }

    /**
     * Exports the solar elevation data to a CSV file.
     *
     * @param file The file to export the data to.
     */
    private void export_csv_data (File file) {
        try {
            var stream = file.replace (null, false, FileCreateFlags.REPLACE_DESTINATION);
            var data_stream = new DataOutputStream (stream);

            // Write CSV metadata as comments
            data_stream.put_string ("# Solar Elevation Data\n");
            data_stream.put_string ("# Date: %s\n".printf (selected_date.format ("%Y-%m-%d")));
            data_stream.put_string ("# Latitude: %.2f degrees\n".printf (latitude));
            data_stream.put_string ("# Longitude: %.2f degrees\n".printf (longitude));
            data_stream.put_string ("# Timezone: UTC%+.2f\n".printf (timezone_offset_hours));
            data_stream.put_string ("#\n");

            // Write CSV header
            data_stream.put_string ("Time,Solar Elevation (degrees)\n");

            // Write data points
            for (int i = 0; i < RESOLUTION_PER_MIN; i += 1) {
                int hours = i / 60;
                int minutes = i % 60;
                data_stream.put_string (
                    "%02d:%02d,%.3f\n".printf (hours, minutes, sun_angles[i])
                );
            }

            data_stream.close ();
        } catch (Error e) {
            message ("Error saving CSV file: %s", e.message);
        }
    }

    /**
     * Application entry point.
     *
     * Creates and runs the SolarAngleApp instance.
     *
     * @param args Command line arguments.
     * @return Exit code.
     */
    public static int main (string[] args) {
        var app = new SolarAngleApp ();
        return app.run (args);
    }
}
编译与运行说明
- 文件最上方的 shebang 指定了编译命令,其包含了:
- 指定 Vala 编译器(
#!/usr/bin/env -S vala)。 - 添加 gtk4 包(
--pkg=gtk4)。 - 链接数学库 (
-lm)。 - 各种编译优化参数(如
-O2、-march=native等)。
- 指定 Vala 编译器(
- 运行前请确保系统已安装 Vala、GTK4 以及相关编译工具(如
gcc)。- 在 Arch Linux 上,可以使用以下命令安装所需的包:
sudo pacman -S --needed vala gtk4 - Windows 用户可以使用 MSYS2 环境,安装相关包:
pacman -S --needed mingw-w64-ucrt-x86_64-vala mingw-w64-ucrt-x86_64-gcc mingw-w64-ucrt-x86_64-gtk4
- 在 Arch Linux 上,可以使用以下命令安装所需的包:
- 可以直接执行该脚本,也可以在命令行中使用如下命令进行编译:
valac --pkg gtk4 -X -lm -X -pipe -X -O2 solaranglegtk.vala编译后将生成
solaranglegtk可执行文件,直接运行即可。
Libadwaita/GTK4应用:太阳高度角计算与绘制工具
在前面的 GTK4 示例之后,我们来看一下如何使用 Libadwaita 来构建具有现代 GNOME 桌面风格的应用程序。Libadwaita 是 GTK4 的官方配套库,旨在帮助开发者构建遵循 GNOME 人机交互指南 (HIG) 的应用程序。它提供了一系列符合现代设计趋势的、自适应的控件和布局容器,能够让应用在 GNOME 桌面环境中拥有一致且美观的用户体验。
对于 GTK/Vala 开发者而言,引入 Libadwaita 可以:
- 遵循 HIG:更容易创建符合 GNOME 设计规范的应用。
- 现代控件:可以使用如
Adw.HeaderBar,Adw.PreferencesGroup,Adw.ActionRow,Adw.SpinRow等专为现代应用设计的控件。 - 自适应布局:Libadwaita 的许多控件和容器都考虑了不同窗口大小和设备的适应性。
- 深色模式支持:内置了对系统深色模式的良好支持和切换能力。
这个 Libadwaita 版本的太阳高度角计算工具,其核心计算逻辑与上一个 GTK4 版本完全相同,主要区别在于用户界面的构建方式和整体外观风格。我们将重点介绍 Libadwaita 特有的控件和概念。
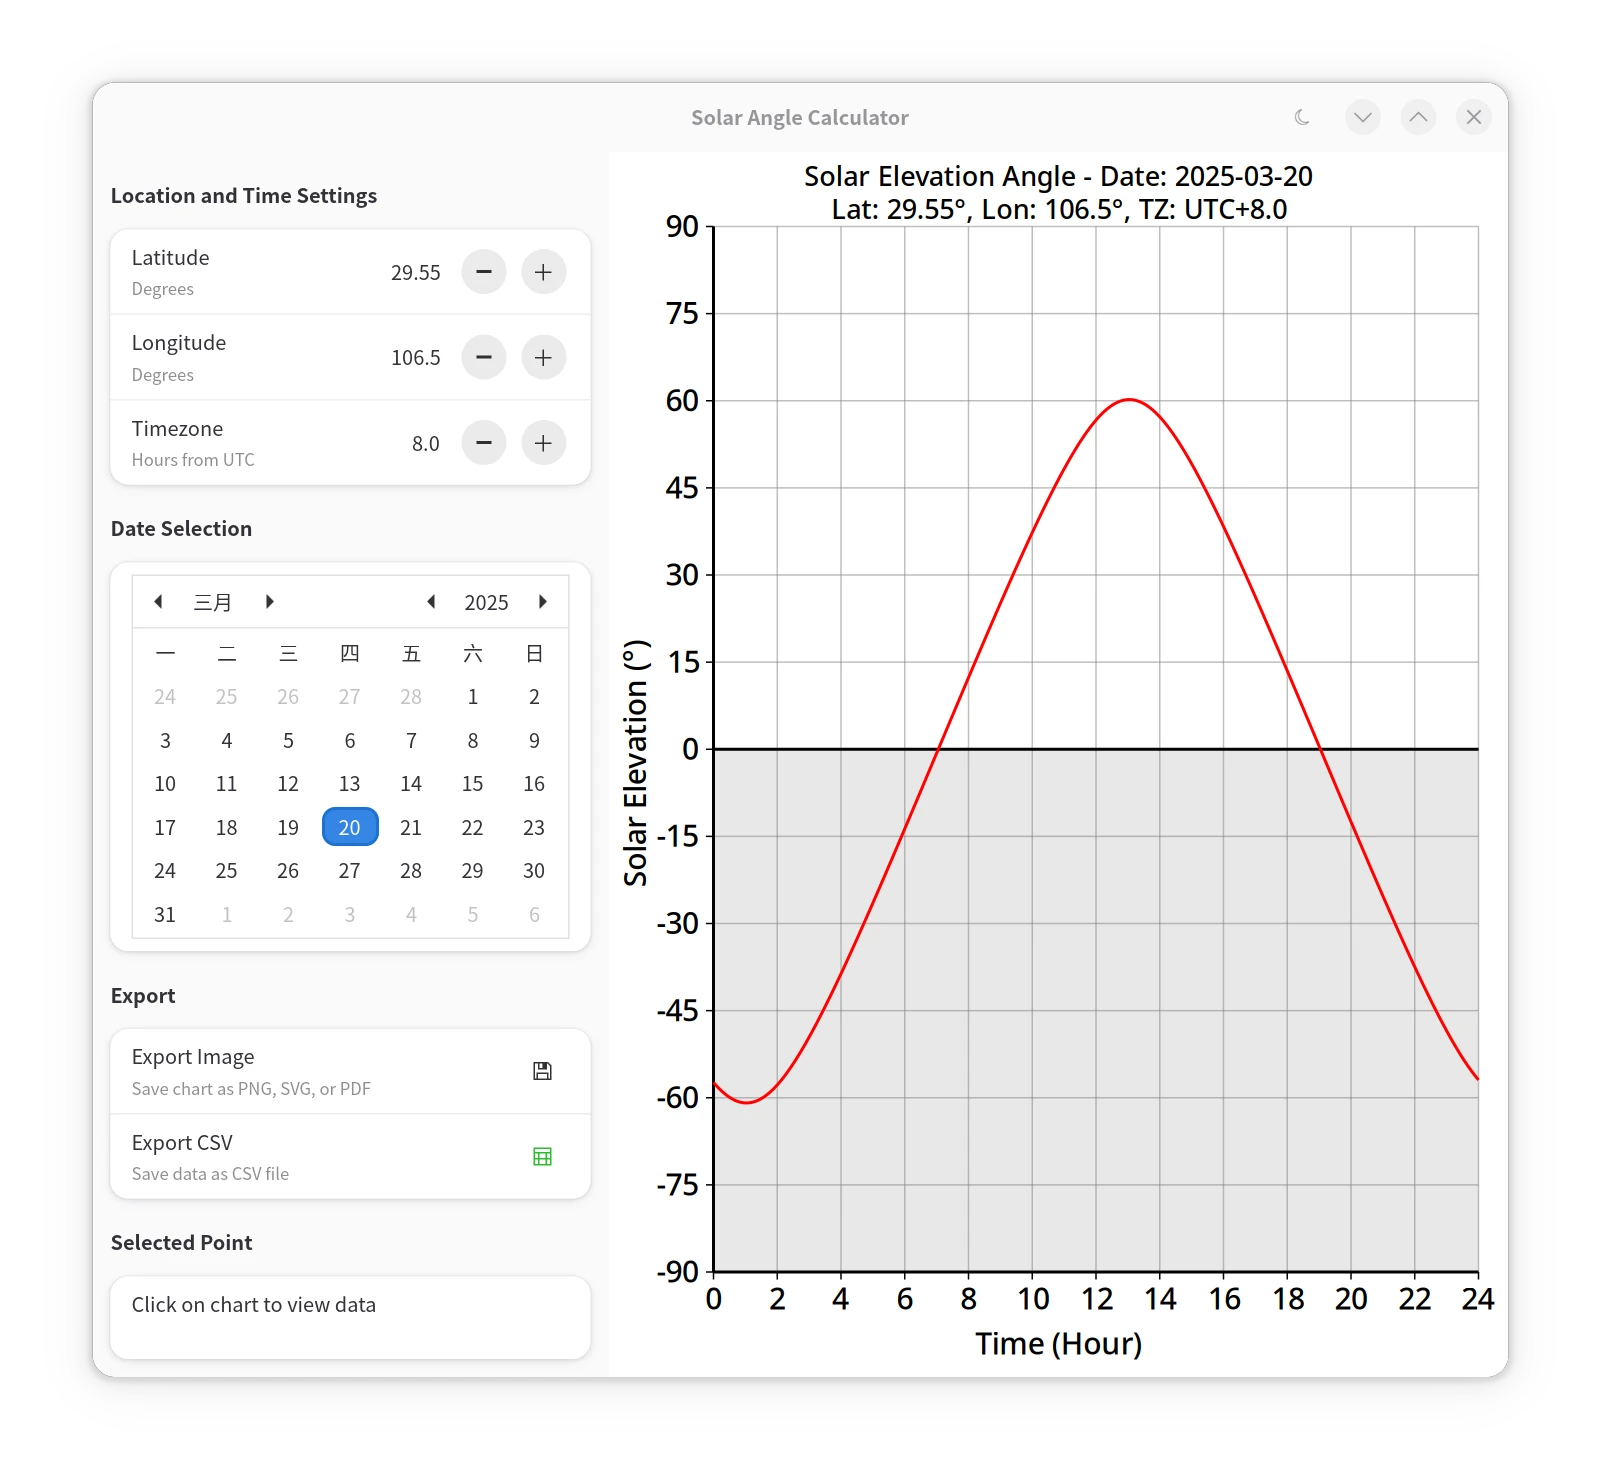
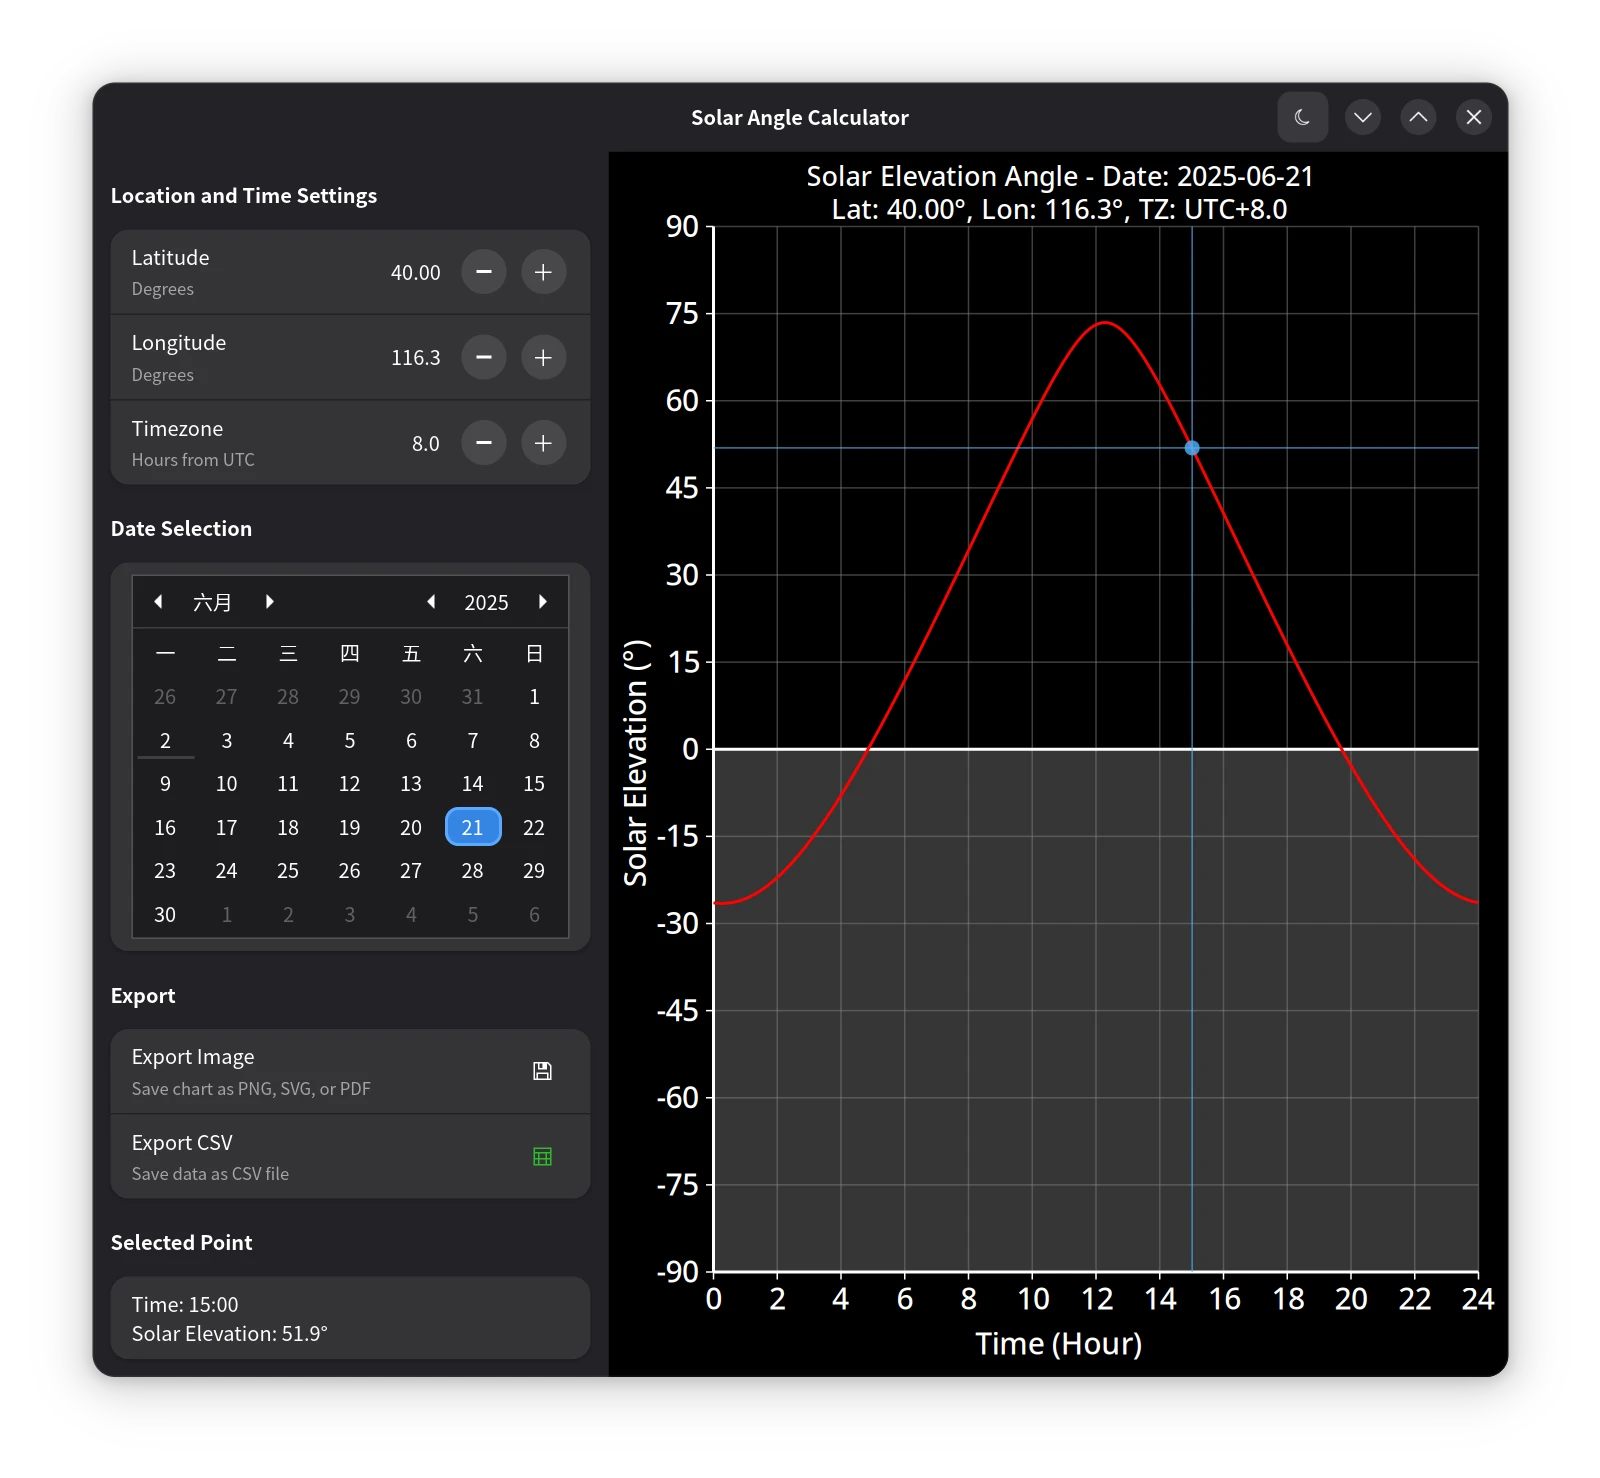
运行效果
 |
 |
|---|---|
| 重庆(北半球春分) | 北京(北半球夏至,深色模式) |
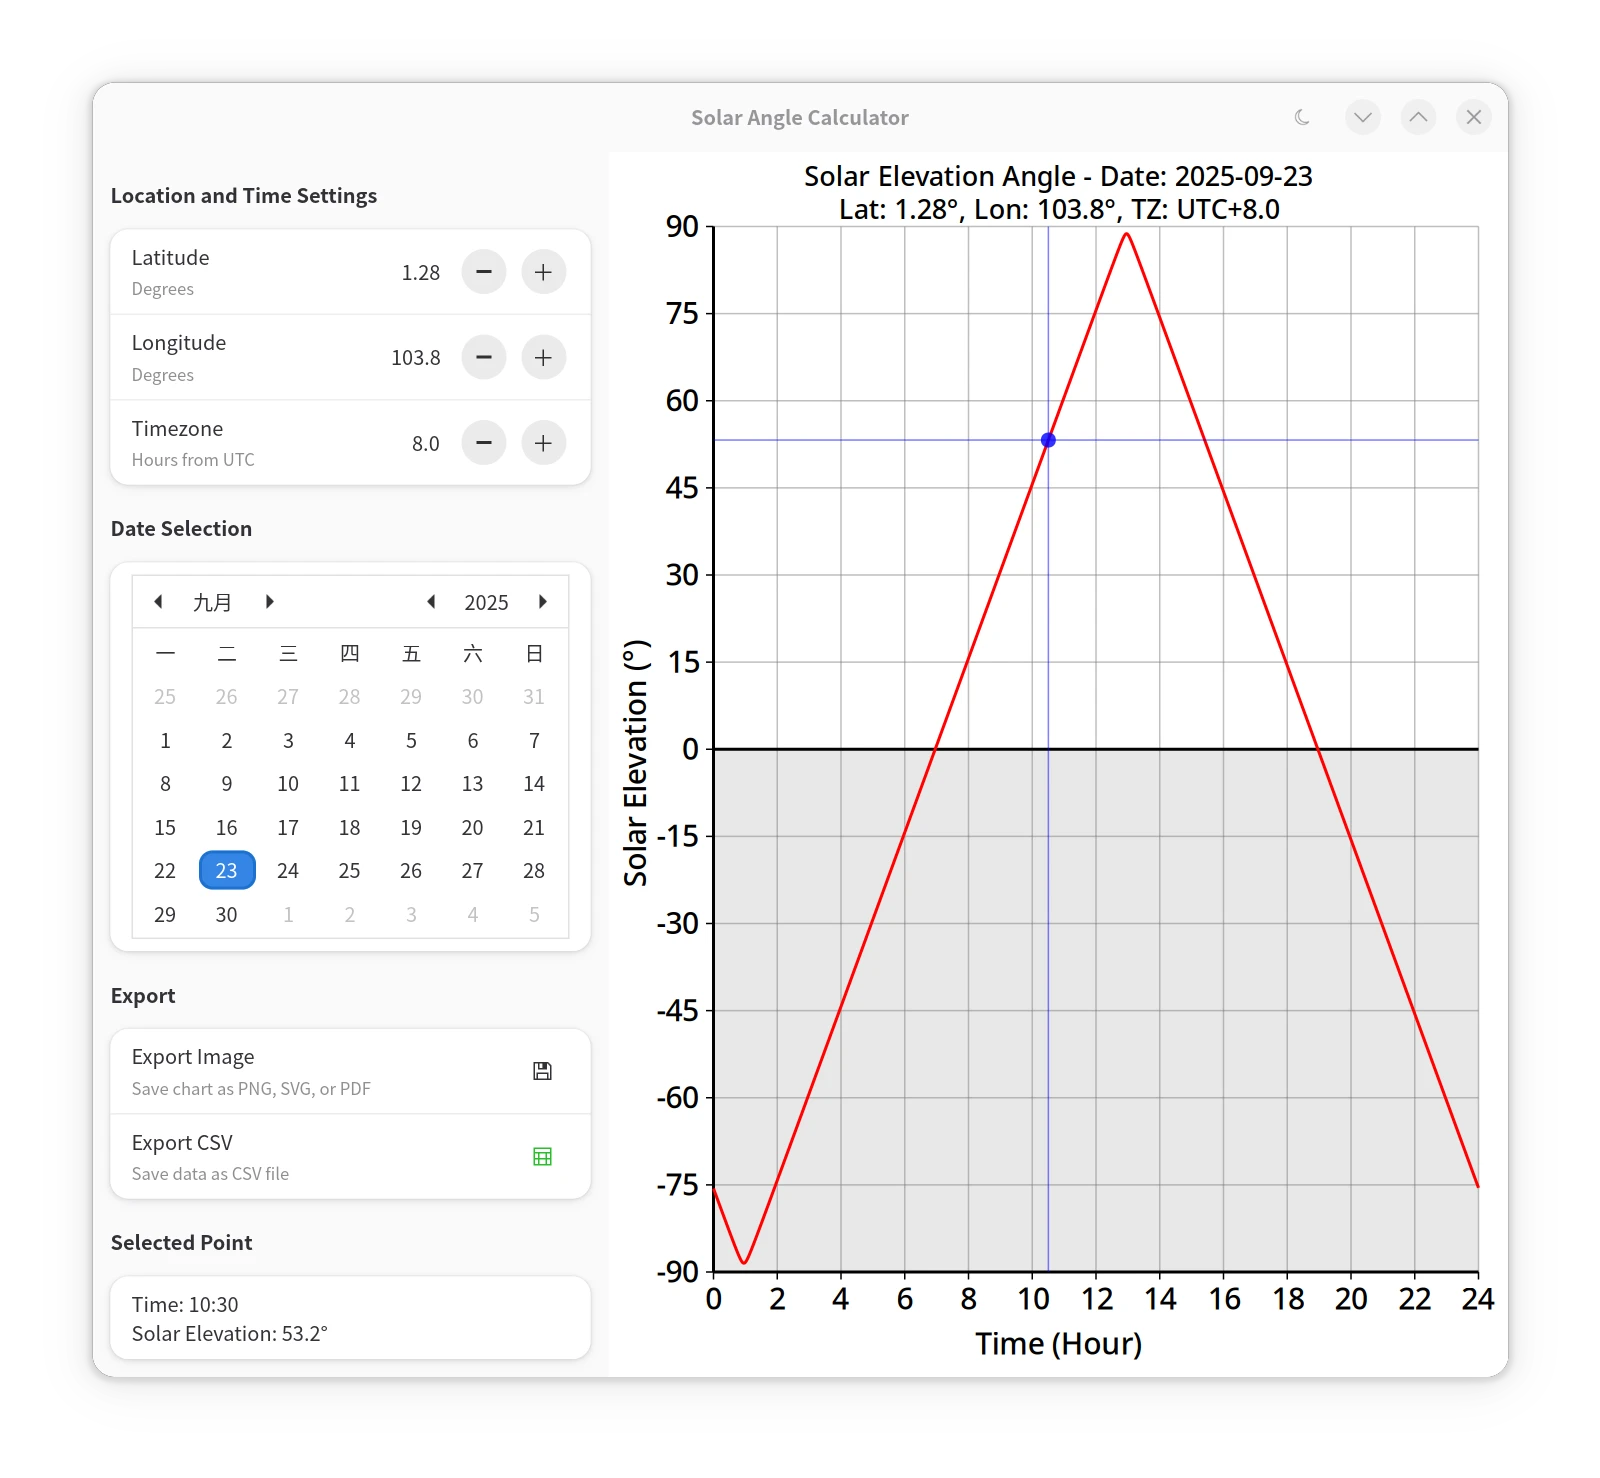 |
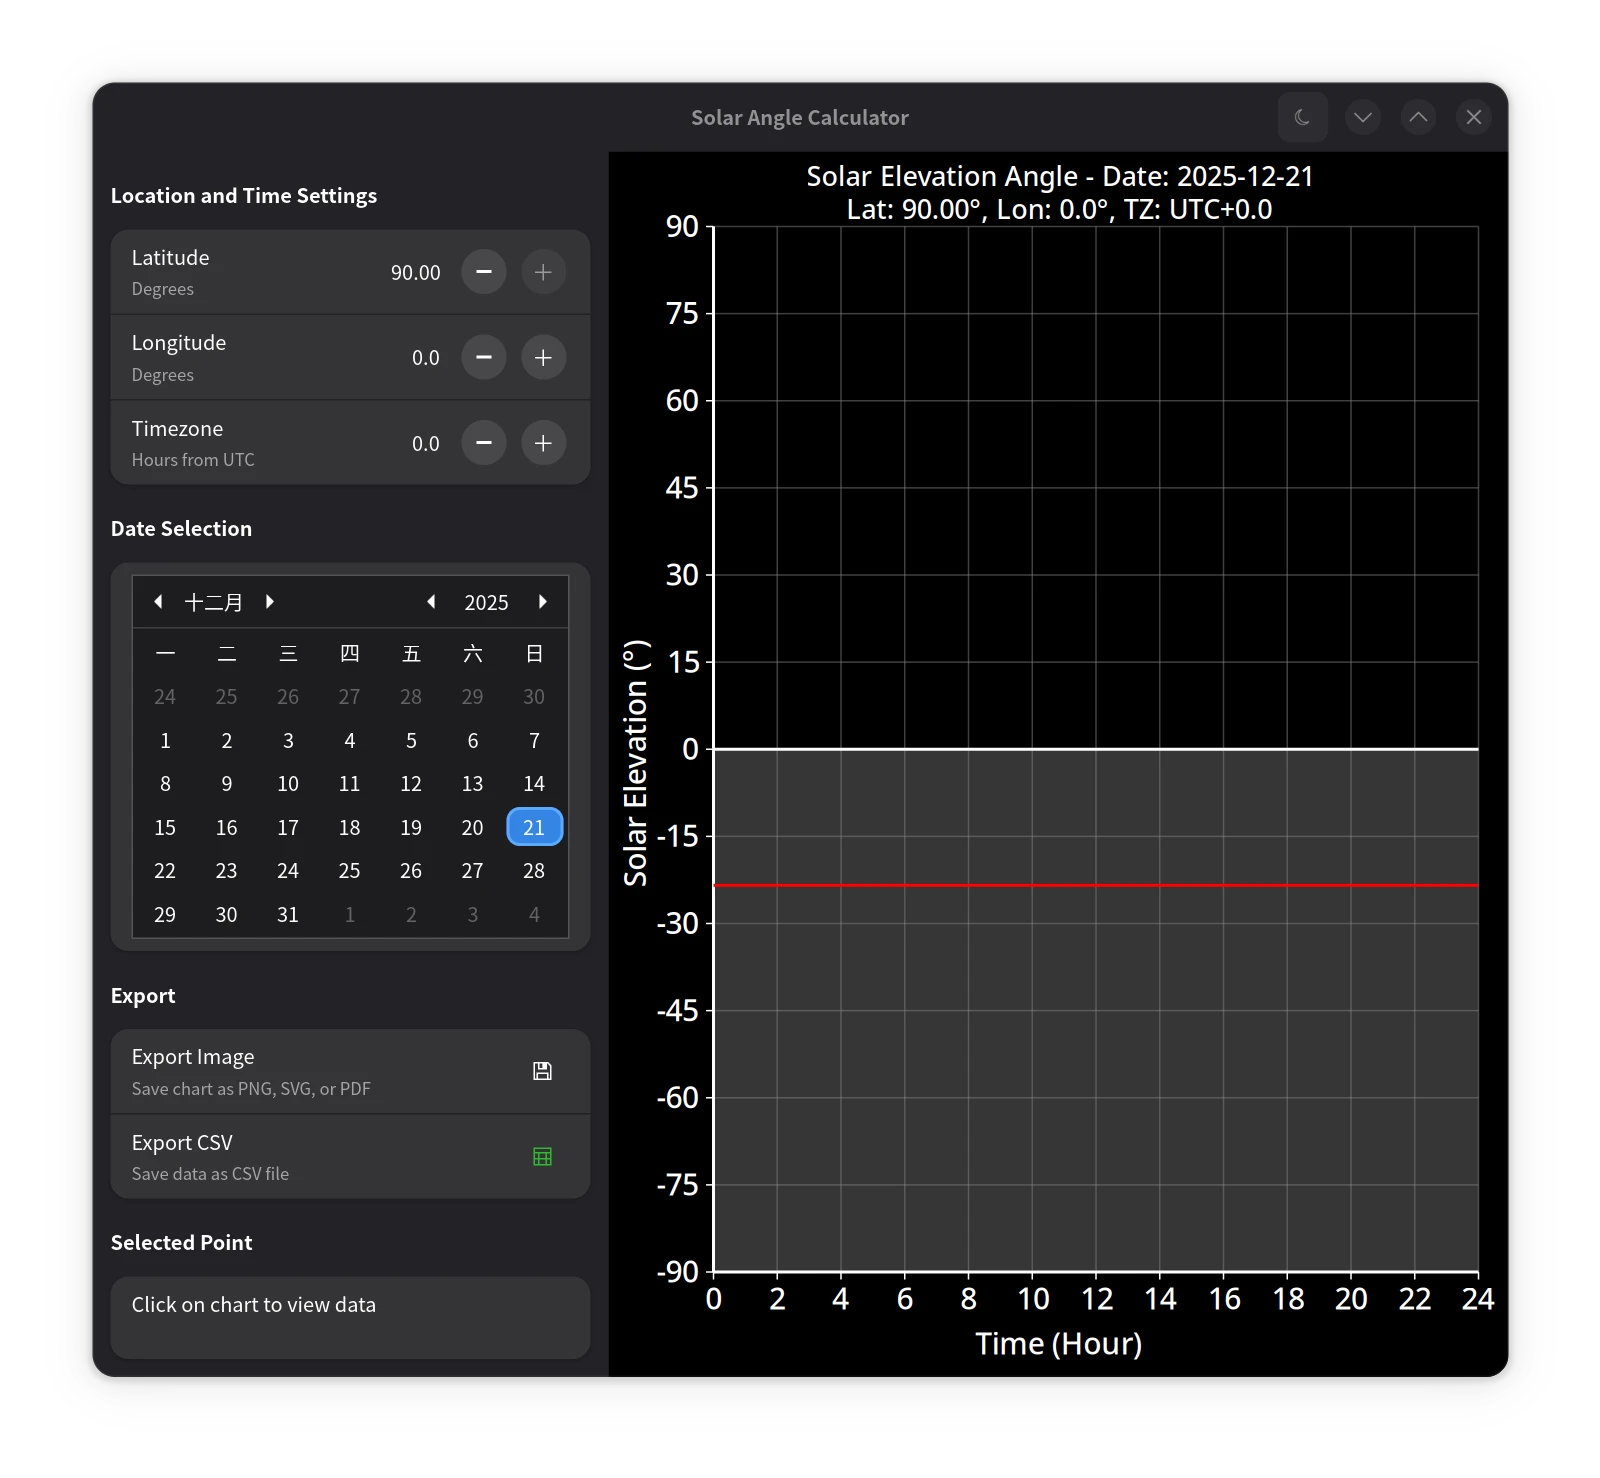 |
| 新加坡(北半球秋分) | 北极点(北半球冬至,深色模式) |
程序架构 (Libadwaita UI 特点)
应用与窗口基类
Adw.Application:取代了Gtk.Application,作为 Libadwaita 应用的入口和管理者。Adw.ApplicationWindow:取代了Gtk.ApplicationWindow,是 Libadwaita 应用的主窗口,能更好地与Adw.HeaderBar等 Libadwaita 组件集成。
主体布局与顶栏
Adw.ToolbarView:这是一个强大的容器,用于组织带有工具栏(如Adw.HeaderBar)的内容视图。在本例中,它作为窗口的主要内容,顶部添加了Adw.HeaderBar。Adw.HeaderBar:取代了传统的标题栏和Gtk.HeaderBar,提供了更灵活的自定义空间。Adw.WindowTitle:放置在Adw.HeaderBar的title_widget属性中,用于显示居中的窗口标题和副标题(本例中副标题为空)。- 深色模式切换按钮 (
Gtk.ToggleButton):被添加到Adw.HeaderBar的末尾 (pack_end)。- 通过
style_manager.color_scheme来控制应用的主题(强制浅色、强制深色或跟随系统)。 - 按钮的
active状态与style_manager.dark(一个布尔值,指示当前是否为深色模式)绑定。 - 监听
style_manager.notify["dark"]信号,以便在系统主题切换时(如果应用设置为跟随系统主题)自动重绘图表。
- 通过
左侧控制面板
左侧面板 (left_panel) 依然是一个垂直的 Gtk.Box,但其内部的设置项组织方式发生了显著变化,大量使用了 Libadwaita 的偏好设置相关控件,使其外观更符合 GNOME 设置应用的风格。
Adw.PreferencesGroup:用于将相关的设置项组织在一起,并显示一个可选的标题。本例中分别用于“Location and Time Settings”、“Date Selection”、“Export”和“Selected Point”这几组。这比单纯使用Gtk.Box和Gtk.Label作为标题提供了更规范和美观的分组方式。- 位置和时间设置 (
Adw.PreferencesGroup)Adw.SpinRow:这是 Libadwaita 中用于数字输入的行控件,它整合了标题、副标题(可选)和一个Gtk.SpinButton。相比于之前 GTK4 版本中手动组合Gtk.Label和Gtk.SpinButton,Adw.SpinRow提供了更简洁、统一的 HIG 风格。title属性设置行标题(如 “Latitude”)。subtitle属性提供额外说明(如 “Degrees”)。with_range()构造函数设置范围和步长。digits控制小数位数。- 通过监听其
notify["value"]信号来响应值的变化(注意,这里不是直接连接Gtk.SpinButton的value_changed信号,而是监听Adw.SpinRow自身的value属性变化通知)。
- 日期选择 (
Adw.PreferencesGroup)Gtk.Calendar:日历控件本身保持不变。Adw.ActionRow:Gtk.Calendar被放置在一个Adw.ActionRow中,再添加到Adw.PreferencesGroup。Adw.ActionRow是一个通用的行控件,可以包含自定义子控件,并可以设置标题、副标题以及可激活状态。这里它主要作为日历控件的容器,使其融入PreferencesGroup的整体风格。
- 导出 (
Adw.PreferencesGroup)Adw.ActionRow:用于“Export Image”和“Export CSV”两个操作。title和subtitle提供了清晰的操作说明。activatable = true使得整行都可以被点击以触发操作。add_suffix(Gtk.Widget):通过此方法在行的末尾添加了一个图标按钮 (Gtk.Button),提供了明确的视觉触发点。按钮设置了icon_name和css_classes = { "flat" }以获得扁平化外观。- 行的
activated信号和按钮的clicked信号都连接到相应的导出处理函数。
- 点击信息 (
Adw.PreferencesGroup)Gtk.Label(click_info_label):用于显示图表上点击点的信息,同样被包装在一个Adw.ActionRow中。
绘图区域与主题适配
Gtk.DrawingArea(drawing_area):绘图区域的核心功能不变,依然使用 Cairo 进行自定义绘图。- 主题颜色结构体 (
ThemeColors):- 为了让绘图区域的颜色能够适应 Libadwaita 的浅色和深色主题,定义了一个
ThemeColors结构体,其中包含了背景、网格、坐标轴、文本、曲线、阴影区域、点击点标记和辅助线等元素的颜色值。 - 创建了
LIGHT_THEME和DARK_THEME两个ThemeColors实例,分别存储浅色和深色模式下的颜色配置。
- 为了让绘图区域的颜色能够适应 Libadwaita 的浅色和深色主题,定义了一个
draw_sun_angle_chart函数的适配:- 在绘图函数的开始,通过
style_manager.dark判断当前是否为深色模式。 - 根据判断结果选择
DARK_THEME或LIGHT_THEME中的颜色来设置 Cairo 的绘图源。这确保了图表内容(如背景、文字、线条颜色)与应用整体主题保持一致。
- 在绘图函数的开始,通过
事件处理
- 大部分事件处理逻辑与 GTK4 版本相似。
Adw.SpinRow的值改变通过notify["value"]信号捕获。Adw.ActionRow的激活通过activated信号捕获。- 深色模式切换按钮的
toggled信号用于改变Adw.StyleManager.color_scheme。 - 系统主题变化通过
style_manager.notify["dark"]信号捕获,并触发绘图区域重绘。
实现代码
#!/usr/bin/env -S vala --pkg=gtk4 --pkg=libadwaita-1 -X -lm -X -O2 -X -march=native -X -pipe
/**
* Solar Angle Calculator Application.
*
* A libadwaita application that calculates and visualizes solar elevation angles
* throughout the day for a given location and date. The application provides
* an interactive interface for setting latitude, longitude, timezone, and date,
* and displays a real-time chart of solar elevation angles with export capabilities.
*/
public class SolarAngleApp : Adw.Application {
// Constants for solar angle calculations
private const double DEG2RAD = Math.PI / 180.0;
private const double RAD2DEG = 180.0 / Math.PI;
private const int RESOLUTION_PER_MIN = 1440; // 1 sample per minute
// Constants for margins in the drawing area
private const int MARGIN_LEFT = 70;
private const int MARGIN_RIGHT = 20;
private const int MARGIN_TOP = 50;
private const int MARGIN_BOTTOM = 70;
private Adw.ApplicationWindow window;
private Gtk.DrawingArea drawing_area;
private Gtk.Label click_info_label;
private DateTime selected_date;
private double sun_angles[RESOLUTION_PER_MIN];
private double latitude = 0.0;
private double longitude = 0.0;
private double timezone_offset_hours = 0.0;
private double clicked_time_hours = 0.0;
private double corresponding_angle = 0.0;
private bool has_click_point = false;
// Color theme struct for chart drawing
private struct ThemeColors {
// Background colors
double bg_r; double bg_g; double bg_b;
// Grid colors with alpha
double grid_r; double grid_g; double grid_b; double grid_a;
// Axis colors
double axis_r; double axis_g; double axis_b;
// Text colors
double text_r; double text_g; double text_b;
// Curve colors
double curve_r; double curve_g; double curve_b;
// Shaded area colors with alpha
double shade_r; double shade_g; double shade_b; double shade_a;
// Click point colors
double point_r; double point_g; double point_b;
// Guide line colors with alpha
double line_r; double line_g; double line_b; double line_a;
}
// Light theme color constants
private ThemeColors LIGHT_THEME = {
bg_r: 1.0, bg_g: 1.0, bg_b: 1.0, // White background
grid_r: 0.5, grid_g: 0.5, grid_b: 0.5, grid_a: 0.5, // Gray grid
axis_r: 0.0, axis_g: 0.0, axis_b: 0.0, // Black axes
text_r: 0.0, text_g: 0.0, text_b: 0.0, // Black text
curve_r: 1.0, curve_g: 0.0, curve_b: 0.0, // Red curve
shade_r: 0.7, shade_g: 0.7, shade_b: 0.7, shade_a: 0.3, // Light gray shade
point_r: 0.0, point_g: 0.0, point_b: 1.0, // Blue point
line_r: 0.0, line_g: 0.0, line_b: 1.0, line_a: 0.5 // Blue guide lines
};
// Dark theme color constants
private ThemeColors DARK_THEME = {
bg_r: 0.0, bg_g: 0.0, bg_b: 0.0, // Black background
grid_r: 0.5, grid_g: 0.5, grid_b: 0.5, grid_a: 0.5, // Light gray grid
axis_r: 1.0, axis_g: 1.0, axis_b: 1.0, // White axes
text_r: 1.0, text_g: 1.0, text_b: 1.0, // White text
curve_r: 1.0, curve_g: 0.0, curve_b: 0.0, // Bright red curve
shade_r: 0.3, shade_g: 0.3, shade_b: 0.3, shade_a: 0.7, // Dark gray shade
point_r: 0.3, point_g: 0.7, point_b: 1.0, // Light blue point
line_r: 0.3, line_g: 0.7, line_b: 1.0, line_a: 0.7 // Light blue guide lines
};
/**
* Creates a new SolarAngleApp instance.
*
* Initializes the application with a unique application ID and sets
* the selected date to the current local date.
*/
public SolarAngleApp () {
Object (application_id: "com.github.wszqkzqk.SolarAngleAdw");
selected_date = new DateTime.now_local ();
}
/**
* Activates the application and creates the main window.
*
* Sets up the user interface including input controls, drawing area,
* and initializes the plot data with current settings.
*/
protected override void activate () {
window = new Adw.ApplicationWindow (this) {
title = "Solar Angle Calculator",
};
// Create header bar
var header_bar = new Adw.HeaderBar () {
title_widget = new Adw.WindowTitle ("Solar Angle Calculator", ""),
};
// Add dark mode toggle button
var dark_mode_button = new Gtk.ToggleButton () {
icon_name = "weather-clear-night-symbolic",
tooltip_text = "Toggle dark mode",
active = style_manager.dark,
};
dark_mode_button.toggled.connect (() => {
if (dark_mode_button.active) {
style_manager.color_scheme = Adw.ColorScheme.FORCE_DARK;
} else {
style_manager.color_scheme = Adw.ColorScheme.FORCE_LIGHT;
}
drawing_area.queue_draw ();
});
// Listen for system theme changes
style_manager.notify["dark"].connect (() => {
drawing_area.queue_draw ();
});
header_bar.pack_end (dark_mode_button);
// Create toolbar view to hold header bar and content
var toolbar_view = new Adw.ToolbarView ();
toolbar_view.add_top_bar (header_bar);
var main_box = new Gtk.Box (Gtk.Orientation.HORIZONTAL, 0);
var left_panel = new Gtk.Box (Gtk.Orientation.VERTICAL, 12) {
hexpand = false,
vexpand = true,
width_request = 320,
margin_start = 12,
margin_end = 12,
margin_top = 12,
margin_bottom = 12,
};
// Location and Time Settings Group
var location_time_group = new Adw.PreferencesGroup () {
title = "Location and Time Settings",
};
var latitude_row = new Adw.SpinRow.with_range (-90, 90, 0.1) {
title = "Latitude",
subtitle = "Degrees",
value = latitude,
digits = 2,
};
latitude_row.notify["value"].connect (() => {
latitude = latitude_row.value;
update_plot_data ();
drawing_area.queue_draw ();
});
var longitude_row = new Adw.SpinRow.with_range (-180.0, 180.0, 0.1) {
title = "Longitude",
subtitle = "Degrees",
value = longitude,
digits = 2,
};
longitude_row.notify["value"].connect (() => {
longitude = longitude_row.value;
update_plot_data ();
drawing_area.queue_draw ();
});
var timezone_row = new Adw.SpinRow.with_range (-12.0, 14.0, 0.5) {
title = "Timezone",
subtitle = "Hours from UTC",
value = timezone_offset_hours,
digits = 2,
};
timezone_row.notify["value"].connect (() => {
timezone_offset_hours = timezone_row.value;
update_plot_data ();
drawing_area.queue_draw ();
});
location_time_group.add (latitude_row);
location_time_group.add (longitude_row);
location_time_group.add (timezone_row);
// Date Selection Group
var date_group = new Adw.PreferencesGroup () {
title = "Date Selection",
};
var calendar = new Gtk.Calendar () {
margin_start = 12,
margin_end = 12,
margin_top = 6,
margin_bottom = 6,
};
calendar.day_selected.connect (() => {
selected_date = calendar.get_date ();
update_plot_data ();
drawing_area.queue_draw ();
});
var calendar_row = new Adw.ActionRow ();
calendar_row.child = calendar;
date_group.add (calendar_row);
// Export Group
var export_group = new Adw.PreferencesGroup () {
title = "Export",
};
var export_image_row = new Adw.ActionRow () {
title = "Export Image",
subtitle = "Save chart as PNG, SVG, or PDF",
activatable = true,
};
var export_image_button = new Gtk.Button () {
icon_name = "document-save-symbolic",
valign = Gtk.Align.CENTER,
css_classes = { "flat" },
};
export_image_button.clicked.connect (on_export_clicked);
export_image_row.add_suffix (export_image_button);
export_image_row.activated.connect (on_export_clicked);
var export_csv_row = new Adw.ActionRow () {
title = "Export CSV",
subtitle = "Save data as CSV file",
activatable = true,
};
var export_csv_button = new Gtk.Button () {
icon_name = "x-office-spreadsheet-symbolic",
valign = Gtk.Align.CENTER,
css_classes = { "flat" },
};
export_csv_button.clicked.connect (on_export_csv_clicked);
export_csv_row.add_suffix (export_csv_button);
export_csv_row.activated.connect (on_export_csv_clicked);
export_group.add (export_image_row);
export_group.add (export_csv_row);
// Click Info Group
var click_info_group = new Adw.PreferencesGroup () {
title = "Selected Point",
};
click_info_label = new Gtk.Label ("Click on chart to view data\n") {
halign = Gtk.Align.START,
margin_start = 12,
margin_end = 12,
margin_top = 6,
margin_bottom = 6,
wrap = true,
};
var click_info_row = new Adw.ActionRow ();
click_info_row.child = click_info_label;
click_info_group.add (click_info_row);
left_panel.append (location_time_group);
left_panel.append (date_group);
left_panel.append (export_group);
left_panel.append (click_info_group);
drawing_area = new Gtk.DrawingArea () {
hexpand = true,
vexpand = true,
width_request = 600,
height_request = 500,
};
drawing_area.set_draw_func (draw_sun_angle_chart);
// Add click event controller
var click_controller = new Gtk.GestureClick ();
click_controller.pressed.connect (on_chart_clicked);
drawing_area.add_controller (click_controller);
main_box.append (left_panel);
main_box.append (drawing_area);
toolbar_view.content = main_box;
update_plot_data ();
window.content = toolbar_view;
window.present ();
}
/**
* Calculates solar elevation angles for each minute of the day.
*
* @param latitude_rad Latitude in radians.
* @param day_of_year Day of the year (1-365/366).
* @param year The year.
* @param longitude_deg Longitude in degrees.
* @param timezone_offset_hrs Timezone offset from UTC in hours.
*/
private void generate_sun_angles (double latitude_rad, int day_of_year, int year, double longitude_deg, double timezone_offset_hrs) {
double sin_lat = Math.sin (latitude_rad);
double cos_lat = Math.cos (latitude_rad);
double days_in_year = ((year % 4 == 0) && ((year % 100 != 0) || (year % 400 == 0))) ? 366.0 : 365.0;
for (int i = 0; i < RESOLUTION_PER_MIN; i += 1) {
// fractional_day_component: day of year plus fraction of the day
double fractional_day_component = day_of_year - 1 + ((double) i) / RESOLUTION_PER_MIN;
// gamma: fractional year angle in radians
double gamma_rad = (2.0 * Math.PI / days_in_year) * fractional_day_component;
// Solar declination delta (rad) via Fourier series approximation
double decl_rad = 0.006918
- 0.399912 * Math.cos (gamma_rad)
+ 0.070257 * Math.sin (gamma_rad)
- 0.006758 * Math.cos (2.0 * gamma_rad)
+ 0.000907 * Math.sin (2.0 * gamma_rad)
- 0.002697 * Math.cos (3.0 * gamma_rad)
+ 0.001480 * Math.sin (3.0 * gamma_rad);
// Equation of Time (EoT) in minutes
double eqtime_minutes = 229.18 * (0.000075
+ 0.001868 * Math.cos (gamma_rad)
- 0.032077 * Math.sin (gamma_rad)
- 0.014615 * Math.cos (2.0 * gamma_rad)
- 0.040849 * Math.sin (2.0 * gamma_rad));
// True Solar Time (TST) in minutes, correcting local clock by EoT and longitude
double tst_minutes = i + eqtime_minutes + 4.0 * longitude_deg - 60.0 * timezone_offset_hrs;
// Hour angle H (°) relative to solar noon
double ha_deg = tst_minutes / 4.0 - 180.0;
double ha_rad = ha_deg * DEG2RAD;
// cos(phi): cosine of zenith angle via spherical trig
double cos_phi = sin_lat * Math.sin (decl_rad) + cos_lat * Math.cos (decl_rad) * Math.cos (ha_rad);
// clamp to valid range
if (cos_phi > 1.0) cos_phi = 1.0;
if (cos_phi < -1.0) cos_phi = -1.0;
// Zenith angle phi (rad)
double phi_rad = Math.acos (cos_phi);
// Solar elevation alpha = 90° - phi, convert to degrees
double solar_elevation_rad = Math.PI / 2.0 - phi_rad;
sun_angles[i] = solar_elevation_rad * RAD2DEG;
}
}
/**
* Updates solar angle data for current settings.
*/
private void update_plot_data () {
int day_of_year = selected_date.get_day_of_year ();
double latitude_rad = latitude * DEG2RAD;
int year = selected_date.get_year ();
generate_sun_angles (latitude_rad, day_of_year, year, longitude, timezone_offset_hours);
// Clear click point when data updates
has_click_point = false;
click_info_label.label = "Click on chart to view data\n";
}
/**
* Handles mouse click events on the chart.
*
* @param n_press Number of button presses.
* @param x X coordinate of the click.
* @param y Y coordinate of the click.
*/
private void on_chart_clicked (int n_press, double x, double y) {
int width = drawing_area.get_width ();
int height = drawing_area.get_height ();
int chart_width = width - MARGIN_LEFT - MARGIN_RIGHT;
// Check if click is within plot area and single click
if (x >= MARGIN_LEFT && x <= width - MARGIN_RIGHT && y >= MARGIN_TOP && y <= height - MARGIN_BOTTOM && n_press == 1) {
// Convert coordinates to time and get corresponding angle
clicked_time_hours = (x - MARGIN_LEFT) / chart_width * 24.0;
int time_minutes = (int) (clicked_time_hours * 60) % RESOLUTION_PER_MIN;
corresponding_angle = sun_angles[time_minutes];
has_click_point = true;
// Format time display
int hours = (int) clicked_time_hours;
int minutes = (int) ((clicked_time_hours - hours) * 60);
// Update info label
string info_text = "Time: %02d:%02d\nSolar Elevation: %.1f°".printf (
hours, minutes, corresponding_angle
);
click_info_label.label = info_text;
drawing_area.queue_draw ();
} else {
// Double click or outside plot area - clear point
has_click_point = false;
click_info_label.label = "Click on chart to view data\n";
drawing_area.queue_draw ();
}
}
/**
* Draws the solar elevation chart.
*
* @param area The drawing area widget.
* @param cr The Cairo context for drawing.
* @param width The width of the drawing area.
* @param height The height of the drawing area.
*/
private void draw_sun_angle_chart (Gtk.DrawingArea area, Cairo.Context cr, int width, int height) {
ThemeColors colors = style_manager.dark ? DARK_THEME : LIGHT_THEME;
// Fill background
cr.set_source_rgb (colors.bg_r, colors.bg_g, colors.bg_b);
cr.paint ();
int chart_width = width - MARGIN_LEFT - MARGIN_RIGHT;
int chart_height = height - MARGIN_TOP - MARGIN_BOTTOM;
double horizon_y = MARGIN_TOP + chart_height * 0.5; // 0° is at middle of -90° to +90° range
// Shade area below horizon
cr.set_source_rgba (colors.shade_r, colors.shade_g, colors.shade_b, colors.shade_a);
cr.rectangle (MARGIN_LEFT, horizon_y, chart_width, height - MARGIN_BOTTOM - horizon_y);
cr.fill ();
// Draw horizontal grid every 15°
cr.set_source_rgba (colors.grid_r, colors.grid_g, colors.grid_b, colors.grid_a);
cr.set_line_width (1);
for (int angle = -90; angle <= 90; angle += 15) {
double tick_y = MARGIN_TOP + chart_height * (90 - angle) / 180.0;
cr.move_to (MARGIN_LEFT, tick_y);
cr.line_to (width - MARGIN_RIGHT, tick_y);
cr.stroke ();
}
// Draw vertical grid every 2 hours
for (int h = 0; h <= 24; h += 2) {
double tick_x = MARGIN_LEFT + chart_width * (h / 24.0);
cr.move_to (tick_x, MARGIN_TOP);
cr.line_to (tick_x, height - MARGIN_BOTTOM);
cr.stroke ();
}
// Draw axes and horizon
cr.set_source_rgb (colors.axis_r, colors.axis_g, colors.axis_b);
cr.set_line_width (2);
cr.move_to (MARGIN_LEFT, height - MARGIN_BOTTOM);
cr.line_to (width - MARGIN_RIGHT, height - MARGIN_BOTTOM);
cr.stroke ();
cr.move_to (MARGIN_LEFT, MARGIN_TOP);
cr.line_to (MARGIN_LEFT, height - MARGIN_BOTTOM);
cr.stroke ();
// Horizon line
cr.move_to (MARGIN_LEFT, horizon_y);
cr.line_to (width - MARGIN_RIGHT, horizon_y);
cr.stroke ();
// Draw axis ticks and labels
cr.set_source_rgb (colors.text_r, colors.text_g, colors.text_b);
cr.set_line_width (1);
cr.set_font_size (20);
for (int angle = -90; angle <= 90; angle += 15) {
double tick_y = MARGIN_TOP + chart_height * (90 - angle) / 180.0;
cr.move_to (MARGIN_LEFT - 5, tick_y);
cr.line_to (MARGIN_LEFT, tick_y);
cr.stroke ();
var te = Cairo.TextExtents ();
var txt = angle.to_string ();
cr.text_extents (txt, out te);
cr.move_to (MARGIN_LEFT - 10 - te.width, tick_y + te.height / 2);
cr.show_text (txt);
}
for (int h = 0; h <= 24; h += 2) {
double tick_x = MARGIN_LEFT + chart_width * (h / 24.0);
cr.move_to (tick_x, height - MARGIN_BOTTOM);
cr.line_to (tick_x, height - MARGIN_BOTTOM + 5);
cr.stroke ();
var te = Cairo.TextExtents ();
var txt = h.to_string ();
cr.text_extents (txt, out te);
cr.move_to (tick_x - te.width / 2, height - MARGIN_BOTTOM + 25);
cr.show_text (txt);
}
// Plot solar elevation curve
cr.set_source_rgb (colors.curve_r, colors.curve_g, colors.curve_b);
cr.set_line_width (2);
for (int i = 0; i < RESOLUTION_PER_MIN; i += 1) {
double x = MARGIN_LEFT + chart_width * (i / (double) (RESOLUTION_PER_MIN - 1));
double y = MARGIN_TOP + chart_height * (90.0 - sun_angles[i]) / 180.0;
if (i == 0) {
cr.move_to (x, y);
} else {
cr.line_to (x, y);
}
}
cr.stroke ();
// Draw click point if exists
if (has_click_point) {
// Calculate current coordinates from stored time and angle
double clicked_x = MARGIN_LEFT + chart_width * (clicked_time_hours / 24.0);
double corresponding_y = MARGIN_TOP + chart_height * (90.0 - corresponding_angle) / 180.0;
cr.set_source_rgba (colors.point_r, colors.point_g, colors.point_b, 0.8);
cr.arc (clicked_x, corresponding_y, 5, 0, 2 * Math.PI);
cr.fill ();
// Draw vertical line to show time
cr.set_source_rgba (colors.line_r, colors.line_g, colors.line_b, colors.line_a);
cr.set_line_width (1);
cr.move_to (clicked_x, MARGIN_TOP);
cr.line_to (clicked_x, height - MARGIN_BOTTOM);
cr.stroke ();
// Draw horizontal line to show angle
cr.move_to (MARGIN_LEFT, corresponding_y);
cr.line_to (width - MARGIN_RIGHT, corresponding_y);
cr.stroke ();
}
// Draw axis titles
cr.set_source_rgb (colors.text_r, colors.text_g, colors.text_b);
cr.set_font_size (20);
string x_title = "Time (Hour)";
Cairo.TextExtents x_ext;
cr.text_extents (x_title, out x_ext);
cr.move_to ((double) width / 2 - x_ext.width / 2, height - MARGIN_BOTTOM + 55);
cr.show_text (x_title);
string y_title = "Solar Elevation (°)";
Cairo.TextExtents y_ext;
cr.text_extents (y_title, out y_ext);
cr.save ();
cr.translate (MARGIN_LEFT - 45, (double)height / 2);
cr.rotate (-Math.PI / 2);
cr.move_to (-y_ext.width / 2, 0);
cr.show_text (y_title);
cr.restore ();
// Draw chart captions
string caption_line1 = "Solar Elevation Angle - Date: %s".printf (selected_date.format ("%Y-%m-%d"));
string caption_line2 = "Lat: %.2f°, Lon: %.2f°, TZ: UTC%+.2f".printf (latitude, longitude, timezone_offset_hours);
cr.set_font_size (18);
Cairo.TextExtents cap_ext1, cap_ext2;
cr.text_extents (caption_line1, out cap_ext1);
cr.text_extents (caption_line2, out cap_ext2);
double total_caption_height = cap_ext1.height + cap_ext2.height + 5;
cr.move_to ((width - cap_ext1.width) / 2, (MARGIN_TOP - total_caption_height) / 2 + cap_ext1.height);
cr.show_text (caption_line1);
cr.move_to ((width - cap_ext2.width) / 2, (MARGIN_TOP - total_caption_height) / 2 + cap_ext1.height + 5 + cap_ext2.height);
cr.show_text (caption_line2);
}
/**
* Handles export button click event.
*
* Shows a file save dialog with filters for PNG, SVG, and PDF formats.
*/
private void on_export_clicked () {
// Show save dialog with PNG, SVG, PDF filters
var png_filter = new Gtk.FileFilter ();
png_filter.name = "PNG Images";
png_filter.add_mime_type ("image/png");
var svg_filter = new Gtk.FileFilter ();
svg_filter.name = "SVG Images";
svg_filter.add_mime_type ("image/svg+xml");
var pdf_filter = new Gtk.FileFilter ();
pdf_filter.name = "PDF Documents";
pdf_filter.add_mime_type ("application/pdf");
var filter_list = new ListStore (typeof (Gtk.FileFilter));
filter_list.append (png_filter);
filter_list.append (svg_filter);
filter_list.append (pdf_filter);
var file_dialog = new Gtk.FileDialog () {
modal = true,
initial_name = "solar_elevation_chart.png",
filters = filter_list,
};
file_dialog.save.begin (window, null, (obj, res) => {
try {
var file = file_dialog.save.end (res);
if (file != null) {
export_chart (file);
}
} catch (Error e) {
message ("Image file has not been saved: %s", e.message);
}
});
}
/**
* Exports the current chart to a file.
*
* Supports PNG, SVG, and PDF formats based on file extension.
* Defaults to PNG if extension is not recognized.
*
* @param file The file to export the chart to.
*/
private void export_chart (File file) {
int width = drawing_area.get_width ();
int height = drawing_area.get_height ();
if (width <= 0 || height <= 0) {
width = 800;
height = 600;
}
string filepath = file.get_path ();
string? extension = null;
var last_dot = filepath.last_index_of_char ('.');
if (last_dot != -1) {
extension = filepath[last_dot:].down ();
}
if (extension == ".svg") {
Cairo.SvgSurface surface = new Cairo.SvgSurface (filepath, width, height);
Cairo.Context cr = new Cairo.Context (surface);
draw_sun_angle_chart (drawing_area, cr, width, height);
} else if (extension == ".pdf") {
Cairo.PdfSurface surface = new Cairo.PdfSurface (filepath, width, height);
Cairo.Context cr = new Cairo.Context (surface);
draw_sun_angle_chart (drawing_area, cr, width, height);
} else {
Cairo.ImageSurface surface = new Cairo.ImageSurface (Cairo.Format.RGB24, width, height);
Cairo.Context cr = new Cairo.Context (surface);
draw_sun_angle_chart (drawing_area, cr, width, height);
surface.write_to_png (filepath);
}
}
/**
* Handles CSV export button click event.
*
* Shows a file save dialog for CSV format.
*/
private void on_export_csv_clicked () {
var csv_filter = new Gtk.FileFilter ();
csv_filter.name = "CSV Files";
csv_filter.add_mime_type ("text/csv");
var filter_list = new ListStore (typeof (Gtk.FileFilter));
filter_list.append (csv_filter);
var file_dialog = new Gtk.FileDialog () {
modal = true,
initial_name = "solar_elevation_data.csv",
filters = filter_list,
};
file_dialog.save.begin (window, null, (obj, res) => {
try {
var file = file_dialog.save.end (res);
if (file != null) {
export_csv_data (file);
}
} catch (Error e) {
message ("CSV file has not been saved: %s", e.message);
}
});
}
/**
* Exports the solar elevation data to a CSV file.
*
* @param file The file to export the data to.
*/
private void export_csv_data (File file) {
try {
var stream = file.replace (null, false, FileCreateFlags.REPLACE_DESTINATION);
var data_stream = new DataOutputStream (stream);
// Write CSV metadata as comments
data_stream.put_string ("# Solar Elevation Data\n");
data_stream.put_string ("# Date: %s\n".printf (selected_date.format ("%Y-%m-%d")));
data_stream.put_string ("# Latitude: %.2f degrees\n".printf (latitude));
data_stream.put_string ("# Longitude: %.2f degrees\n".printf (longitude));
data_stream.put_string ("# Timezone: UTC%+.2f\n".printf (timezone_offset_hours));
data_stream.put_string ("#\n");
// Write CSV header
data_stream.put_string ("Time,Solar Elevation (degrees)\n");
// Write data points
for (int i = 0; i < RESOLUTION_PER_MIN; i += 1) {
int hours = i / 60;
int minutes = i % 60;
data_stream.put_string (
"%02d:%02d,%.3f\n".printf (hours, minutes, sun_angles[i])
);
}
data_stream.close ();
} catch (Error e) {
message ("Error saving CSV file: %s", e.message);
}
}
/**
* Application entry point.
*
* Creates and runs the SolarAngleApp instance.
*
* @param args Command line arguments.
* @return Exit code.
*/
public static int main (string[] args) {
var app = new SolarAngleApp ();
return app.run (args);
}
}
编译与运行说明
- 文件最上方的 shebang 指定了编译命令,除了 GTK4 和数学库外,还需要链接 Libadwaita 库:
#!/usr/bin/env -S vala --pkg=gtk4 --pkg=libadwaita-1 -X -lm -X -O2 -X -march=native -X -pipe
- 运行前请确保系统已安装 Vala、GTK4、Libadwaita 1 (
libadwaita-1-dev或类似包名) 以及相关编译工具。- 在 Arch Linux 上,可以使用以下命令安装所需的包:
sudo pacman -S --needed vala gtk4 libadwaita - Windows 用户可以使用 MSYS2 环境,安装相关包:
pacman -S --needed mingw-w64-ucrt-x86_64-vala mingw-w64-ucrt-x86_64-gcc mingw-w64-ucrt-x86_64-gtk4 mingw-w64-ucrt-x86_64-libadwaita
- 在 Arch Linux 上,可以使用以下命令安装所需的包:
- 可以直接执行该脚本(如果已赋予执行权限
chmod +x solarangleadw.vala),也可以在命令行中使用如下命令进行编译(假设文件名保存为solarangleadw.vala):valac --pkg=gtk4 --pkg=libadwaita-1 -X -lm -X -pipe -X -O2 solarangleadw.vala -o solarangleadw编译后将生成
solarangleadw可执行文件,直接运行即可。
通过这个 Libadwaita 版本的示例,我们可以看到如何利用其提供的组件和特性来构建具有现代 GNOME 外观和感觉的应用程序,同时还能方便地实现如深色模式适配等高级功能。核心业务逻辑保持不变,UI/UX 则通过 Libadwaita 得到了显著提升。